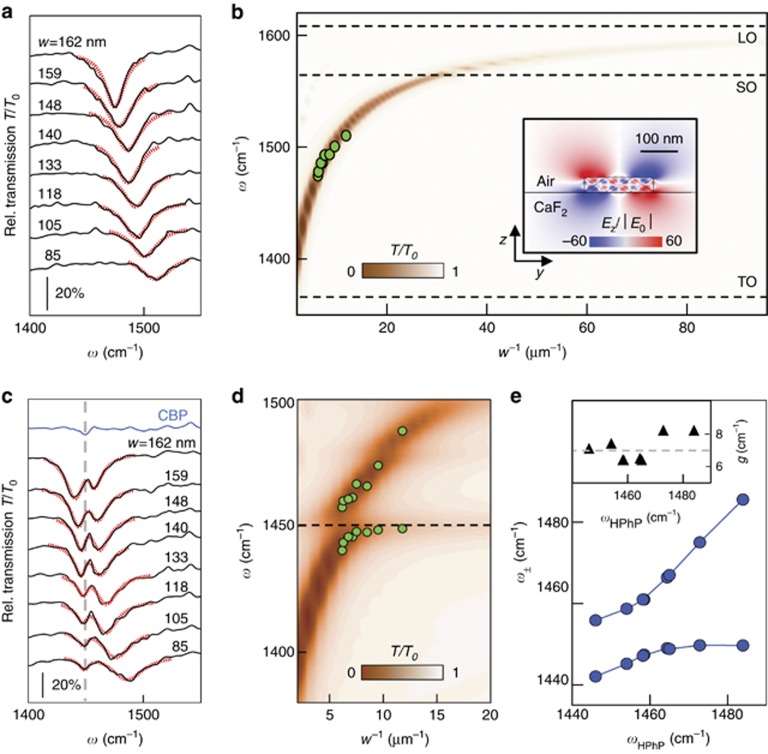
Figure 4.
Infrared spectroscopy of h-BN ribbon arrays with different ribbon widths. (a) Experimental relative transmission spectra of 43-nm-thick h-BN ribbon arrays with fixed period D=400 nm and variable width w. The red dotted lines represent Lorentzian fits. (b) Color plot shows simulated transmission spectra (vertical axis) for 43-nm-thick ribbon arrays as a function of w−1 (horizontal axis). The HPhP resonance dip asymptotically approaches the LO frequency as w−1 increases, as expected for HPhP volume modes34. Green dots show the spectral dip positions obtained by the Lorentzian fits of a. Inset: Vertical electric near-field distribution normalized to the incident field for a ribbon resonator (Ez/|E0|). (c) Same measurements as in a but with 30-nm-thick CPB layer on top of the ribbon array. The red dotted lines represent fits using the classical coupled oscillator model. (d) Color plot shows simulated transmission spectra of the ribbon arrays covered with 30-nm-thick CPB layer. Green dots show the spectral dip positions obtained by Lorentzian fits of individual dips (see Supplementary Information). The black horizontal line indicates the CBP molecular vibrational resonance frequency. (e) Eigenmode frequencies ω± calculated from Equation (1), using the parameters obtained by the coupled oscillator fit of the spectra shown in c, plotted as a function of the bare HPhP resonance frequency ωHPhP obtained via the Lorentzian fits in a. Inset: Coupling strength g obtained by the coupled oscillator fit of the spectra shown in c. Horizontal dashed line marks average value.

