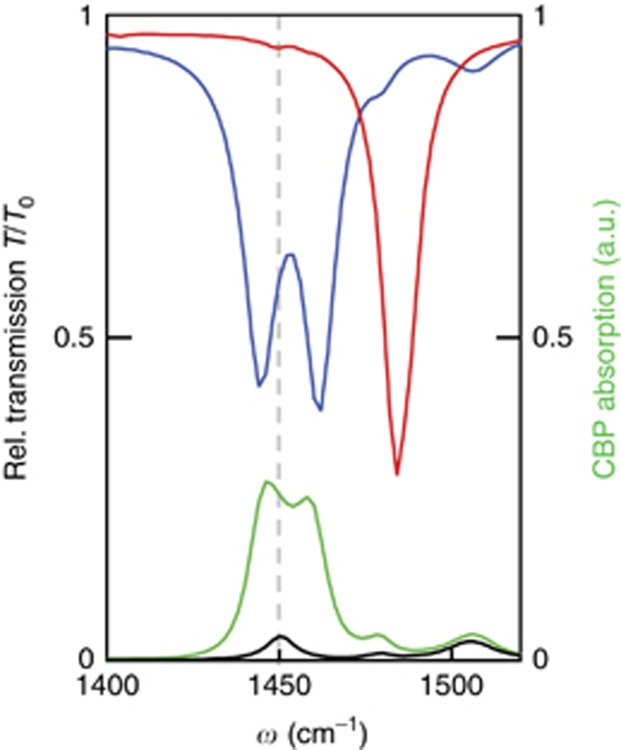
Figure 5.
Numerical study of strong coupling between HPhPs and molecular vibrations of CPB. Red and blue spectra show the calculated transmission for h-BN ribbon arrays with h=43 nm, D=400 nm and w=150 nm, without and with a 30-nm-thick CBP layer on top of the ribbons, respectively. Green and black spectra show the simulated absorption in the CBP layer (integrated over the whole layer thickness) on top of the ribbons and on the bare CaF2 substrate, respectively. The vertical gray dashed line marks the molecular C–H vibration frequency for the uncoupled case.

