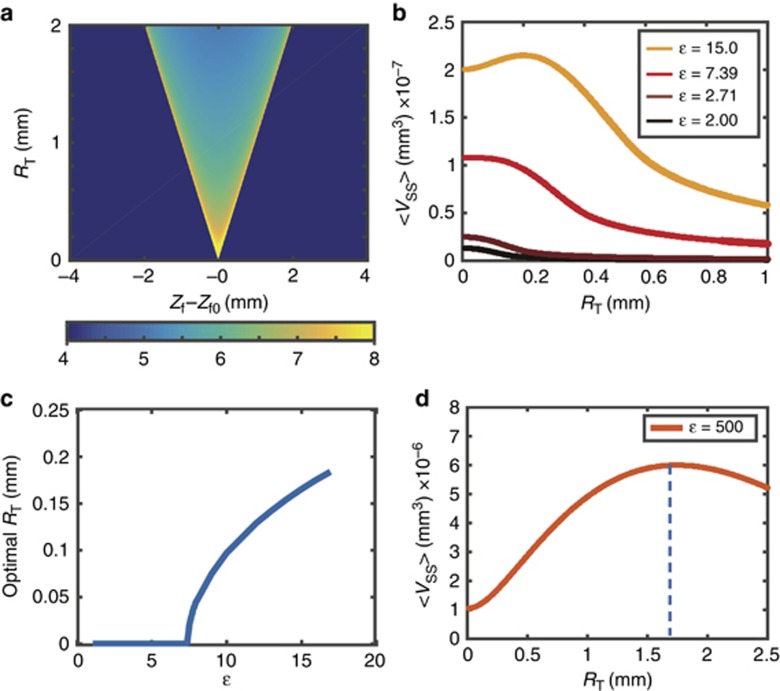
Figure 6.
The PDF of the pulse positions is normalized for each RT and plotted in (a). We then calculate the expected ablated volume, 〈Vss〉, by using Vss and the PDF of the focal position for each scanning range, as plotted in (b). The scanning range that maximizes the ablated volume, optimal RT, is then calculated and plotted in (c). To compare with our silicon experiment, we plot the expected ablated volume as a function of scanning range, which shows the optimal scanning range is at 1.74 mm, as marked by the blue dashed line. This result is close to that used in our experimental conditions.

