Figure 1.
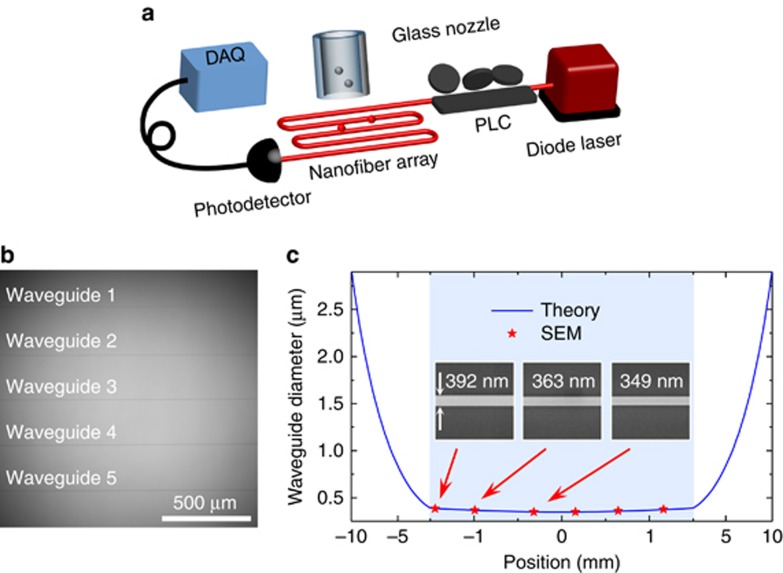
Size probing system. (a) Schematic set-up of nanowaveguide-based size spectrometry. The analyte nanoparticles are blown onto the nanowaveguides via a glass nozzle. DAQ, data acquisition system; PLC, polarization controller. (b) Optical image of the nanowaveguides, consisting of five in-serial identical nanofibers with a distance of 250 μm between each adjacent two. (c) Comparison of the diameter distribution of a nanowaveguide from the theoretical prediction (blue curve) and scanning electron microscopic (SEM) measurements (red stars). Inset shows SEM images of three segments, with diameters of 392, 363 and 349 nm from left to right. The shadow marks the waveguide range with the length of 3 mm, for which the diameter variation is approximately 10%. Note that the scale of the horizontal axis in the range of −1.5 to 1.5 mm is different from the other range.

