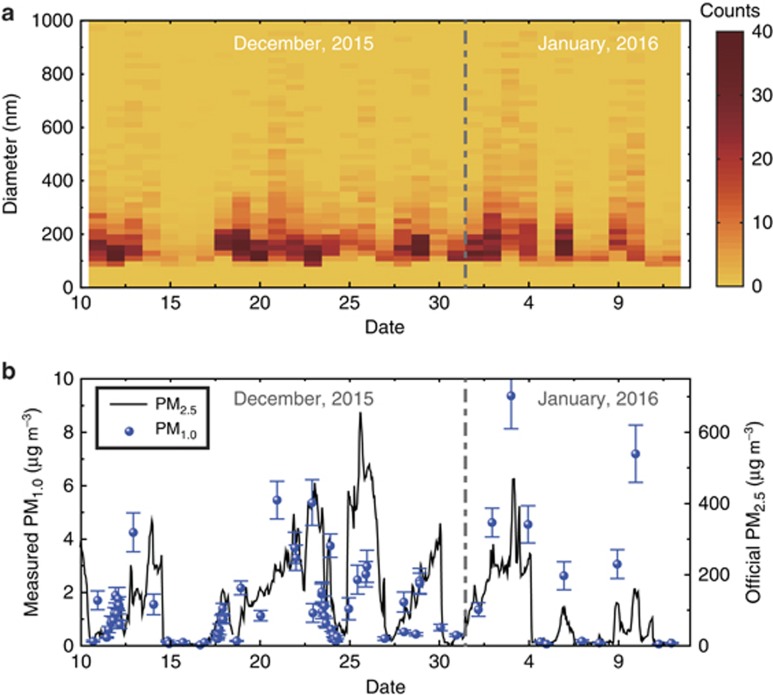
Figure 5.
One-month data for PM1.0 measured by the size spectrometer. The size distribution (a) and the mass concentration (b) of the particulate matter from 11 December 11 2015 to 12 January 2016. The symbols and the solid curve indicate the experimental PM1.0 data and the official PM2.5 data reported by Beijing Municipal Environmental Monitoring Center. The error bars indicate the standard deviation.

