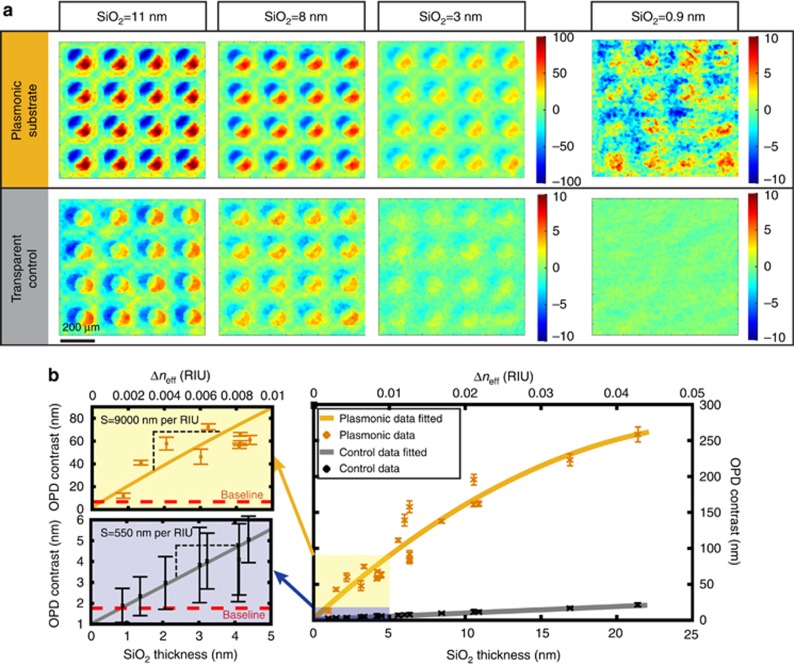
Figure 3.
Silica microarray pattern detection with LIM: comparison of plasmonic and transparent substrates. (a) Color-coded OPD maps of various microarrayed silica (SiO2) thicknesses patterned identically on plasmonic and transparent control substrates. (b) OPD contrast data statistically extracted (36 spots considered on each chip) from plasmonic and transparent microarray patterns are shown as a function of silica thickness, with the low thickness range magnified on the left. The top axis indicates the effective refractive index units of the corresponding thin silica films, for convenience. Baseline indicates the average OPD contrast of the bare substrate. Error bars correspond to standard deviation where N=36.

