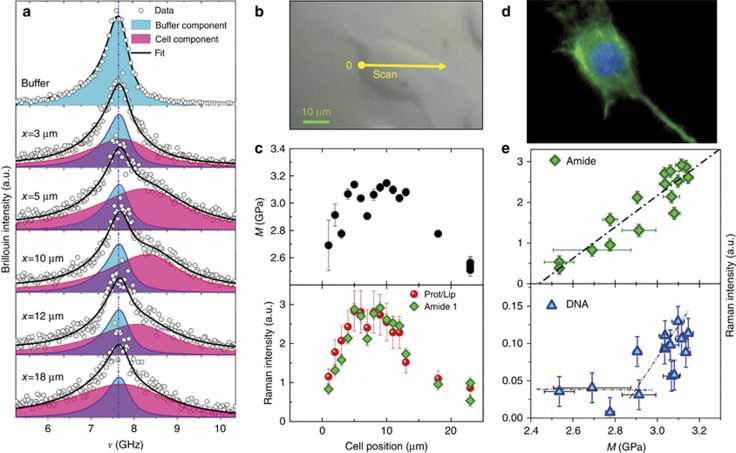
Figure 5.
(a) Brillouin spectra and their deconvolution into cell and buffer components. The adjusted coefficient of determination  is always higher than 0.95 for the entire dataset. The fit was performed by considering a fixed shape of the buffer contribution (sound velocity and kinematic viscosity of the corresponding DHO function). Leaving these parameters as free, or even adding a further DHO function, would not lead to an increase in
  . (b) Cell image. The yellow point is the initial investigated point for the illustrated measurements. The straight arrow along the cell shows the direction in which the measurements were performed. (c) Upper panel Longitudinal elastic modulus M=ρ
V2 as a function of the position. In the fitting procedure, a cellular density ρ=1080 kg m−3 and a refractive index n=1.386 were assumed13; lower panel relative variation of the protein concentration as obtained by the area of the amide 1 Raman peak and by the deconvolution of the carbon–hydrogen (CH) stretching vibrational mode. (d) Fluorescence microscopy image of NIH/3T3 cell seeded onto glass cover slips. The average value of the nuclei size is (14±2) μm, in good agreement with the Raman spectroscopic signatures of the cell nucleus. (e) Raman peak intensities of the protein estimated by the intensity of the amide 1 peak and the DNA vs the longitudinal elastic modulus. A linear fit is shown in the upper panel as a dashed line (Pearson’s r>0.92) while the lines in the lower panel provide a visual representation.

