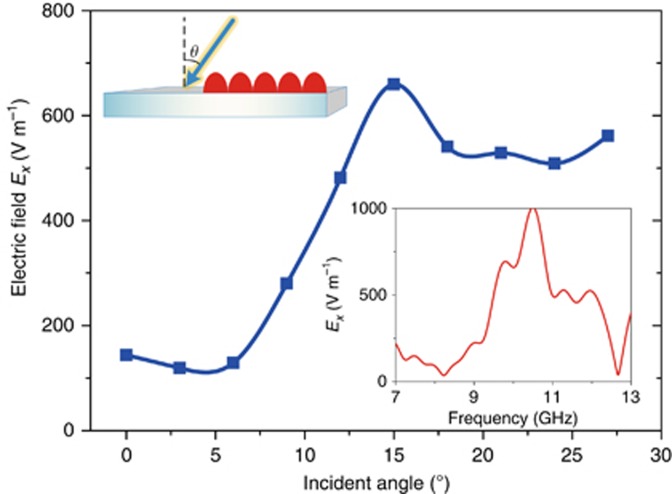
Figure 5.
The electric-field intensity measured at the center of the dielectric board at 10 GHz as the incident angle increases from 0° to 27°. The upper-left inset shows the schematic of the simulation configuration. The bottom-right inset provides the intensity of the electric field measured at the center of the dielectric board in broadband under 15° oblique incidence. All plots are obtained with coding pattern M4 under the TE polarization.

