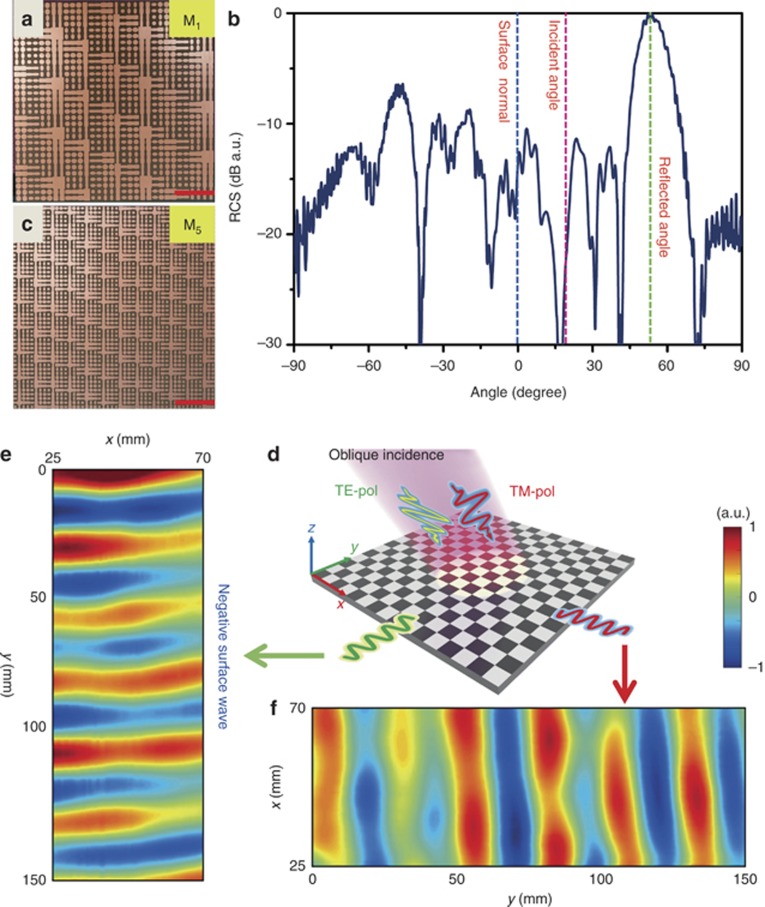
Figure 6.
Experimental results for the far-field and near-field measurements. (a) The fabricated sample with the coding matrix M1. The scale bar corresponds to 60 mm. (b) The measured far-field radiation pattern for the sample with coding matrix M1. (c) The fabricated sample with the coding matrix M5. (d) The schematic illustration of the duplex conversion from spatial waves to SWs under the oblique incidence in the experiments. (e, f) The electric-field distributions (Ex component) measured at 10 GHz on the dielectric substrate under the oblique illumination with x and y-polarizations for coding matrix M5. The scanning area is 45 × 150 mm2 (x × y). The amplitude intensity has been normalized in both plots.

