Figure 5.
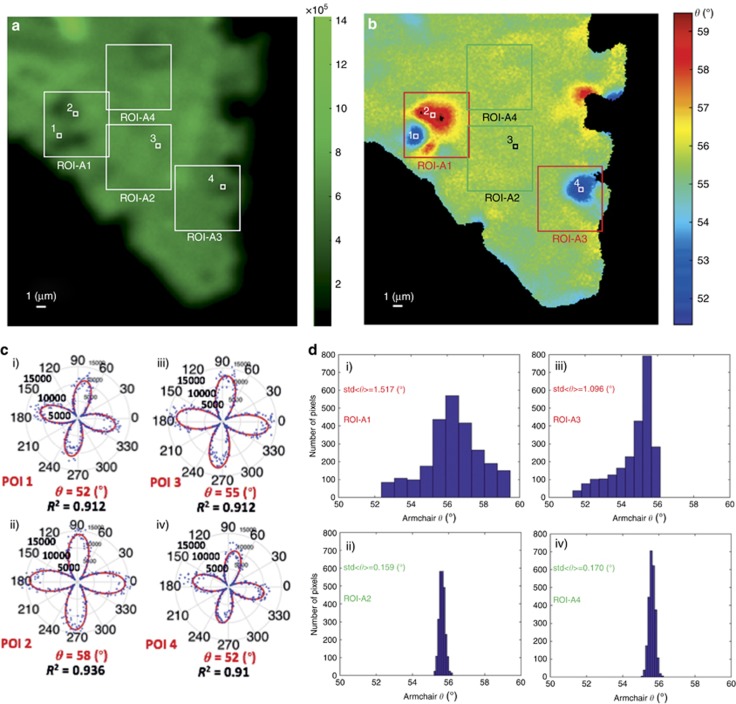
PSHG as a crystal quality marker: (a) Integrated PSHG for φ ∈[0°–90°], step of 1°, for ROI-A shown in Figure 4a. Four ROIs of 50 × 50 pixels, namely, ROI-A1, ROI-A2, ROI-A3 and ROI-A4, and four POIs are indicated. (b) Armchair mapping reveals grains of different crystal orientations, not seen in the SHG intensity image. (c) Experimental PSHG modulation (φ ∈[0°–360°], step of 1°) for POIs 1–4, fitted with Equation (1). (d) Image histograms showing the distribution of armchair orientations inside ROIs-A1-4. The crystal quality is reflected in the standard deviation (σ2D) of the mean armchair direction, <θ>. The grains of different crystal orientations seen in ROIs 1 and 3 gave σ2D values equal to σ2D=1.517° and σ2D=1.096°, respectively, while in ROIs 2 and 4, the uniform distribution of armchair angles resulted in smaller σ2D values, that is, σ2D=0.159° and σ2D=0.17°, respectively. Small σ2D values are indicative of good crystal quality.

