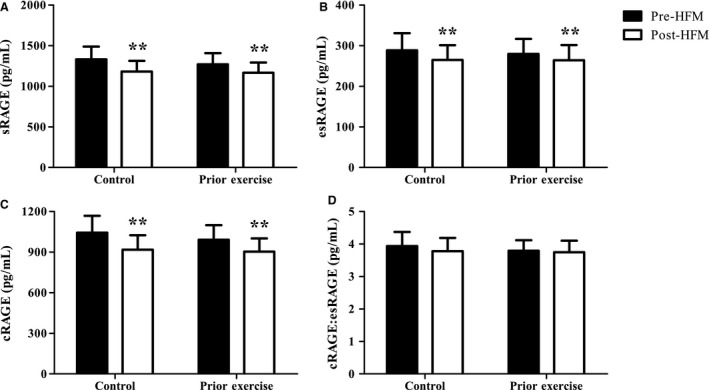
Figure 1.

Decreased postprandial total sRAGE, esRAGE, and cRAGE. Changes in total sRAGE (A), esRAGE (B), cRAGE (C), and the cRAGE:esRAGE ratio (D) with an acute HFM and prior aerobic exercise. Data were analyzed via two‐way ANOVA and data are presented as mean ± SEM. n = 12 for all sRAGE isoforms. **Main effect of HFM P < 0.01.
