
Figure 1.
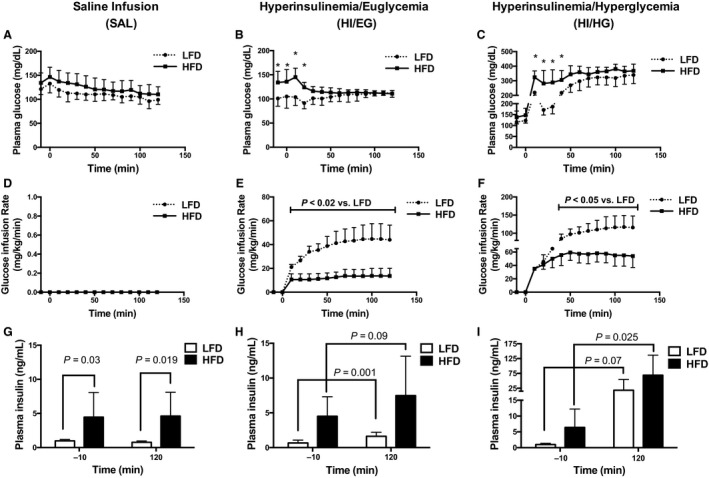
Conditions of the infusion protocols in mice. (A–C) Plasma glucose levels were maintained at similar levels for the low‐fat diet (LFD) and the high‐fat diet (HFD) groups. (D) The SAL infusion did not include a glucose infusion. (E–F) The rate of glucose infusion was greater in the LFD compared to the HFD group. (G) Plasma insulin was elevated throughout the SAL clamp in the HFD group compared to the LFD group. (H–I) Plasma insulin increased in response to the infusion protocols. Panels A–F were analyzed by two‐way ANOVA corrected with Sidak multiple comparison test, *P < 0.05 versus LFD. Panels G–I were analyzed by unpaired t‐test. Data are expressed as means and SD, n = 7–10 per group.