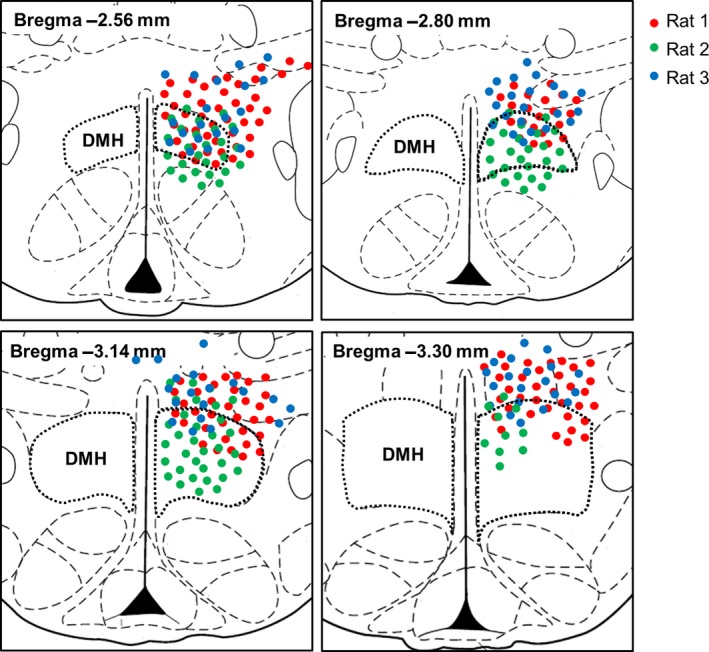
Figure 2.

Mapping of AAV‐hSyn‐hChR2‐EYFP injection sites. Red, green, and blue circles indicate the expression of GFP‐positive cell bodies in rat 1, 2, and 3, respectively, in rostral to caudal levels of the rat hypothalamus. Distances from bregma (mm) are indicated at the left top. The anterior DMH was hit in all three rats. At more posterior bregma's, the dorsal DMH was hit in all rats, but rat 2 also showed GFP‐positive cell bodies in other subdivisions of the DMH. All rats showed some contamination of surrounding areas, especially the DHA.
