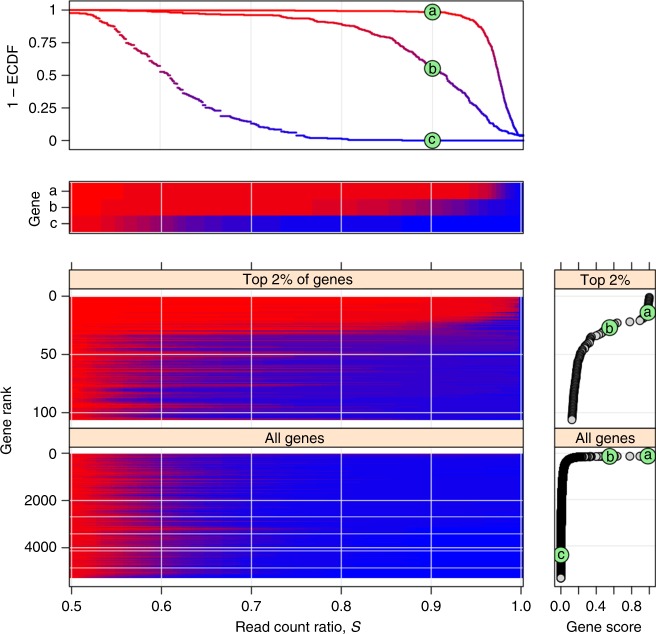
Fig. 2.
Across-individuals distribution of read count ratio S for each gene indicates substantial variation of allelic bias and that <1% of all genes are imprinted. The vertically arranged four main panels present the empirical distribution of Sg across all individuals given each gene g. The upper two panels are distinct representations (survival plot: 1 – ECDF, and “survival heatmap”) of the same three distributions corresponding to a: PEG10, b: ZNF331, and c: AFAP1. PEG10 and ZNF331, previously found to be imprinted in mice or in other human tissues, and one for AFAP1, a gene without prior evidence. The bottom two survival heatmaps present the distribution of Sg for the top 2% and 100% of the 5307 analyzed genes. These are ranked according to gene score defined as 1 – ECDF (0.9) in the bottom far right panels. The score of PEG10, ZNF331, and AFAP1 is marked by a,b,c, respectively, in green circles. As expected, PEG10 and ZNF331 both score high and rank within the top 30 of all genes suggesting they are also imprinted in the present context, the adult human DLFPC. The bottom panels also indicate that <1% of all genes might be imprinted

