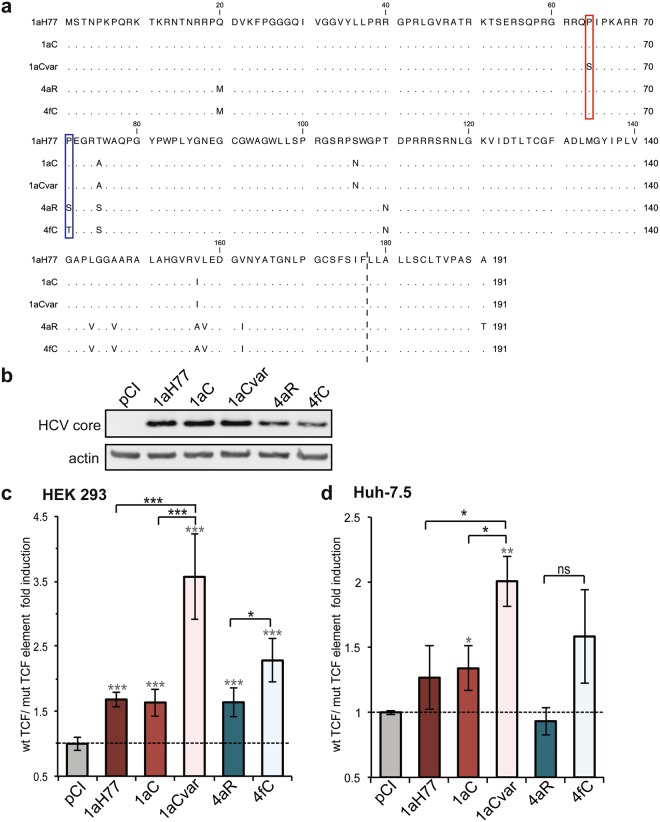
Figure 1.
Effect of HCV core genetic variability on TCF-element dependent transcriptional activity. (a) An amino acid sequence alignment of core proteins from the indicated genotypes and isolates is shown with respect to HCV 1aH77 core. Dots represent identical residues. The dotted line indicates the putative C-terminus of mature core proteins according to the known 2a-JFH1 core C-terminal residue20 following removal of the C-terminal hydrophobic sequence by signal peptide peptidase. Red and blue boxes point to unique amino acid differences between mature core proteins of 1aC/1aCvar and 4aR/4fC variants, respectively. (b) HCV core expression was assessed in transiently transfected cells using anti-core and control anti-actin antibodies (pCI: empty DNA vector; full-length image of corresponding immunoblot can be found in the Supplementary information: Supplementary Fig. 5). HEK293 (c) or Huh-7.5 (d) cells were transfected with core expressing DNAs or pCI vector and either pTOP (wild-type [wt]) or pFOP (mutated [mut]) TCF element reporter DNAs. Relative wt/mut TCF element FLuc ratios are represented [means ± SD of quintuplicates obtained in 3 independent experiments (c) or of triplicates obtained in 2 independent experiments (d)]. The dotted lines indicate thresholds obtained in the absence of any core expression (pCI). Statistical analyses with respect to values obtained in pCI-transfected cells are indicated by grey stars above each bar (when significant), while statistical analyses between two related variants are indicated in black characters above brackets and are coded as follows: P < 0.05 (*), P < 0.005 (**), P < 0.001 (***), non-significant, P ≥ 0.05 (ns).

