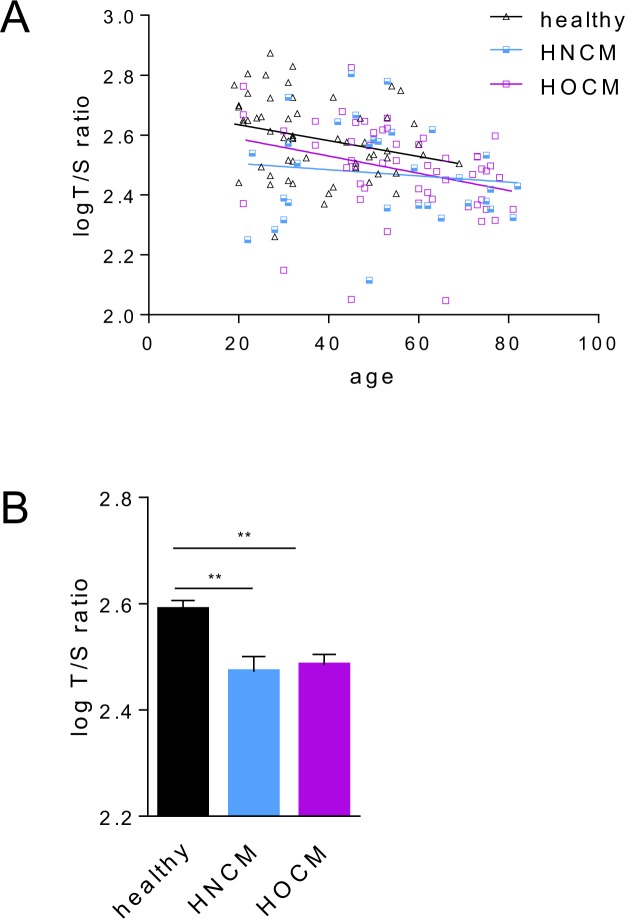
Figure 1.
Telomere length distribution in control, HNCM and HOCM. (A) Relative leukocyte telomere length expressed as the log-transformed ratio of the telomeric sequence to single reference gene (T/S), plotted as a function of age. The negative slopes of the linear regression lines indicate age-related telomere shortening. (B) Average log-transformed T/S ratio in control subjects versus HNCM and HOCM patients. The results are shown as mean ± SD. Between-group differences were analyzed using one-way ANOVA, followed by Tukey’s post hoc test. **P < 0.010.

