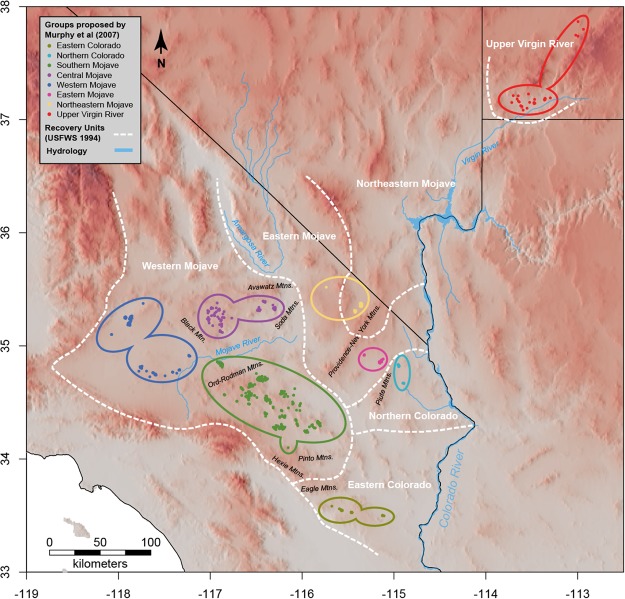
Figure 1.
Map of the area with orographic and hydrological details that might act as barriers. USFWS12 recovery units are delineated in white. Points represent samples used in this study and are colored by the populations inferred by Murphy et al.9. The hillshade effect was computed using the hillShade function in the R package raster46 after extracting slope and aspect rasters from elevation data at a resolution of 3.6 arc seconds (USGS, and Japan ASTER Program, 2011, SC:ASTGTM.002:2088835414, 1B, USGS, Sioux Falls, 2011-10-07, downloaded from https://earthexplorer.usgs.gov/). The map was generated with the R package raster v2.6 (https://cran.r-project.org/web/packages/raster/index.html).

