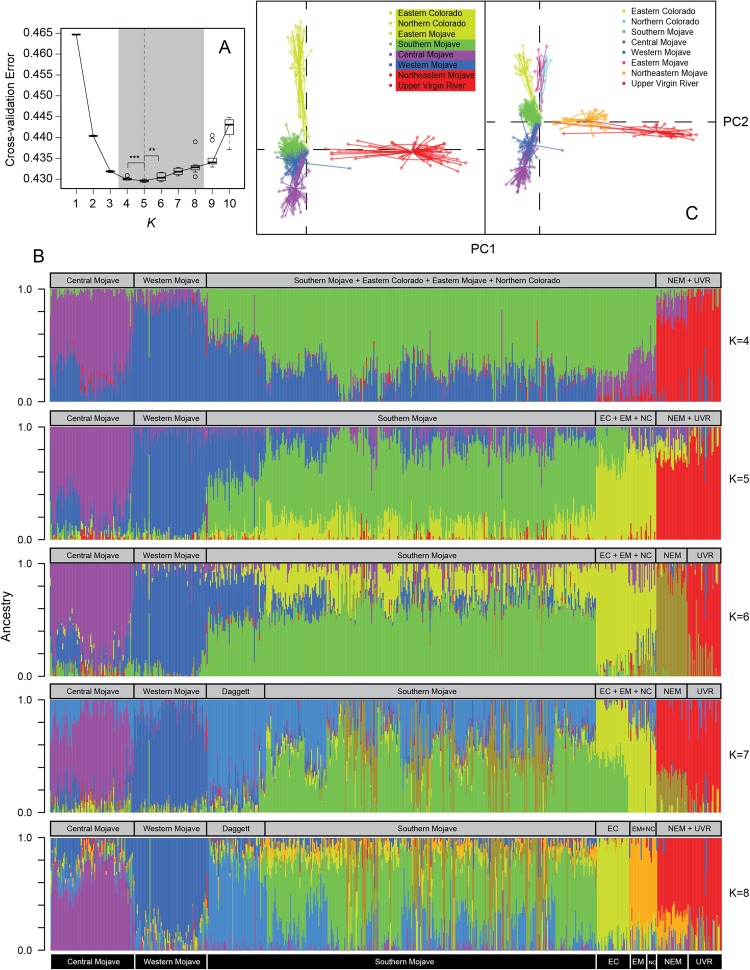
Figure 2.
Analysis of genetic structure in Agassiz’s desert tortoise (Gopherus agassizii). (A) Bootstrapped (n = 10) 5-fold cross-validation error estimations for clusters form K = 1 to K = 10. The best K value is marked with the vertical dashed line. Statistically significant differences were found between the best K, and the second and third best K values, respectively (Wilcoxon rank sum test: W = 91.5, p-value = 0.002 [***]; W = 82,5, p-value = 0.01 [**]). (B) Bar plot with ancestry proportions per individual for 4 to 8 clusters. (C) Genetic ordination analysis using the population structure inferred by Admixture (K = 5) and that from Murphy et al.9 central Mojave (n = 81), western Mojave (n = 71), southern Mojave (n = 374), Eastern Colorado (n = 31), Eastern Mojave (n = 17), Northern Colorado (n = 10), Northeastern Mojave (n = 30), Upper Virgin River (n = 32).

