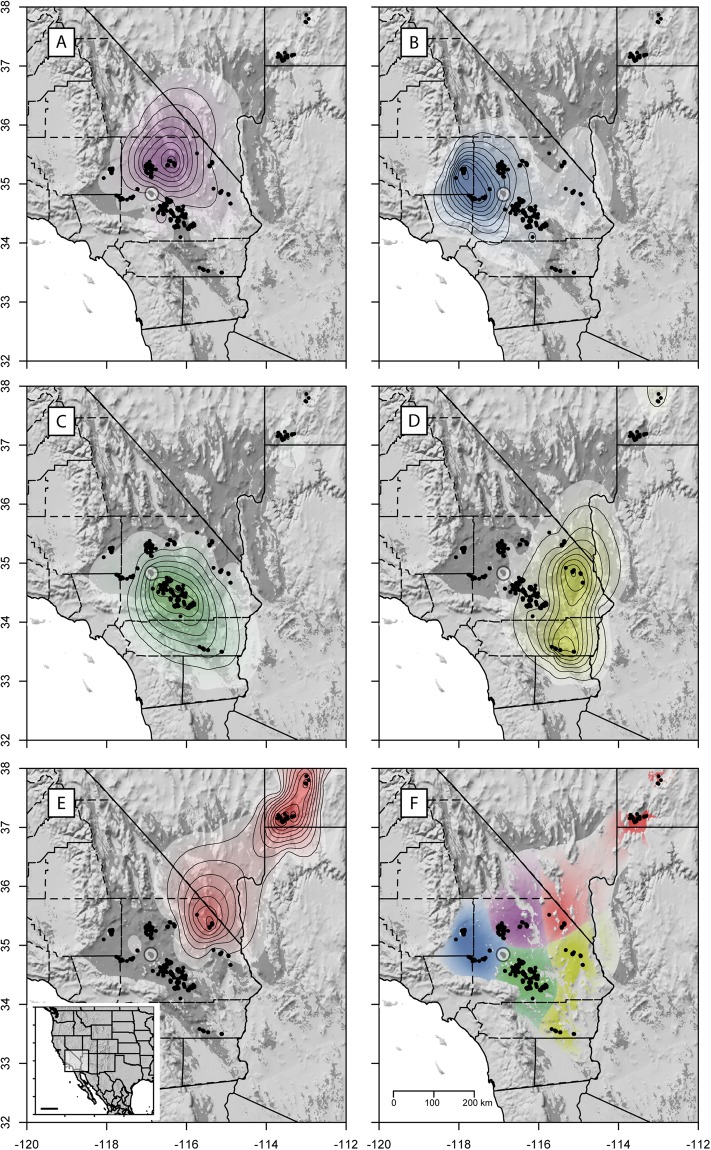
Figure 3.
Spatial interpolation of ancestry coefficients of Agassiz’s desert tortoises (Gopherus agassizii) using Krig modeling, superimposed on a shaded relief (made with Natural Earth. Free vector and raster map data@http://www.naturalearthdata.com/downloads/10m-raster-data/10m-manual-shaded-relief/). (A) Cluster 1; (B) Cluster 2; (C) Cluster 3; (D) Cluster 4; (E) Cluster 5. The last map (F) combines areas of maximal ancestry proportion for each of the five genetic groups. In F, the total area was trimmed using the species distribution model (darker grey area). Contour lines indicate 0.1–0.9 quantiles. The scale bar in the smaller map in E is equivalent to 500 km. The points highlighted in the white, transparent circle indicate to the population at Daggett. Maps were generated with the R package raster v2.6 (https://cran.r-project.org/web/packages/raster/index.html).

