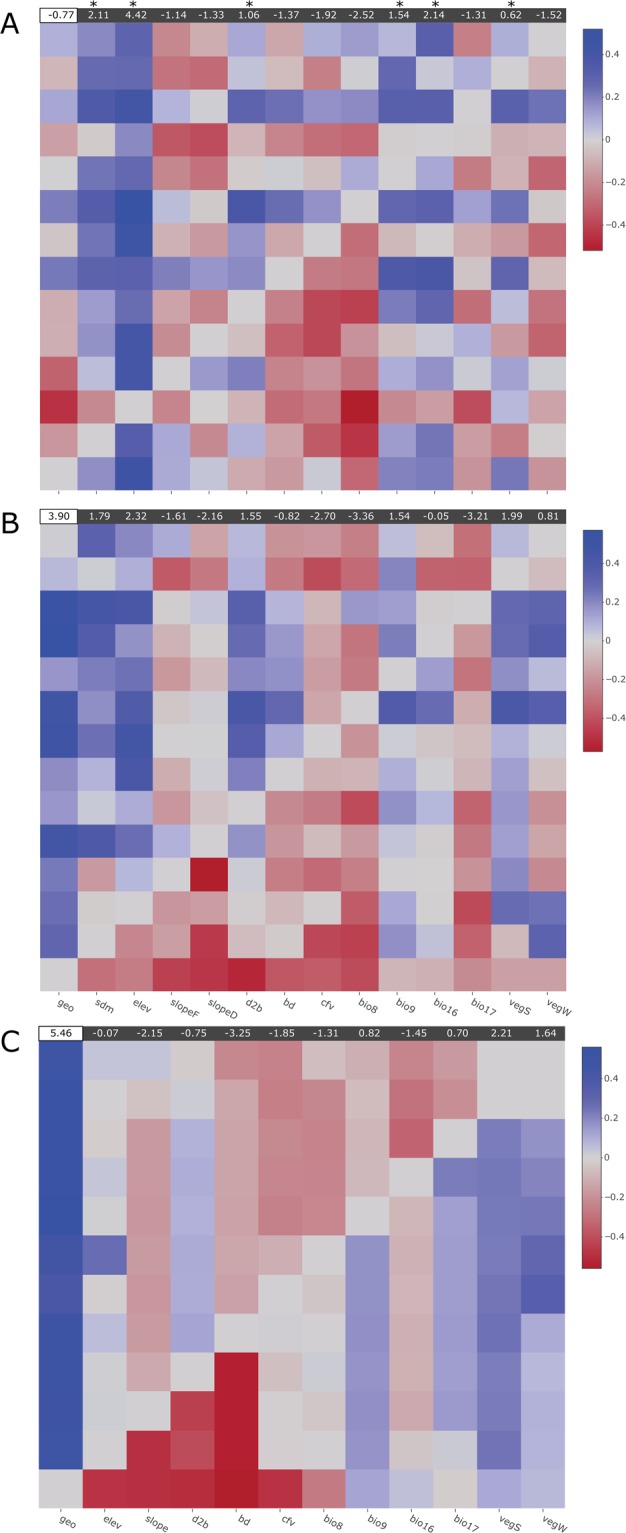
Figure 4.

Pairwise heatmaps with reciprocal causal modelling results showing RmA − RmB for (A) least-cost distance models, (B) resistance-distance models, and (C) environmental distance models. Columns represent the main variables and rows represent the alternative variables. Thus, the figure should be read by columns and not by rows. For each column, blue squares indicate a supported variable against an alternative variable. Red squares indicate support for the alternative variable (degree indicated by scale on the right). On top of each heatmap the RmA−RmB value is summed for the null model (geographic distance), marked by a white box, and the testing variables marked by a grey box. Variables that were better supported than the null model are also marked with an asterisk.
