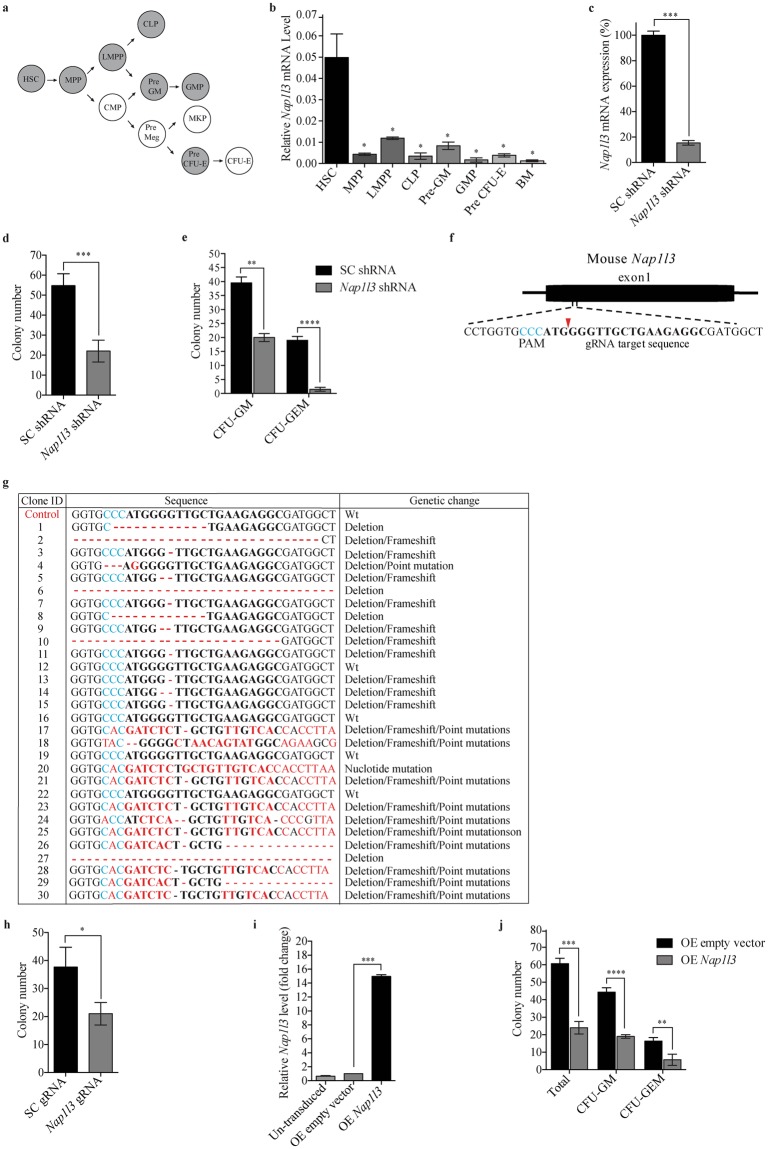
Figure 1.
Nap1l3 is predominantly expressed in murine haematopoietic stem cells and loss of function or overexpression impairs colony-forming capacity. (a) Illustration of 11 different primary murine HSPCs populations. The seven cell populations highlighted in grey were analysed in (b). (b,c) qPCR analysis showing Nap1l3 mRNA levels (normalised to Hprt) of indicated cell populations (b) and of sorted LSK HSCs transduced with an shRNA against Nap1l3 (Nap1l3 shRNA), or a control vector (SC shRNA) (c). The data is represented as the mean ± s.e.m, *p < 0.05, ***p < 0.005 (unpaired t-test), n = 3. (d,e) The total colony numbers (d), and colony numbers of CFU-GM and CFU-GEM (e), formed from LSK HSCs transduced with Nap1l3 shRNA (Nap1l3 shRNA) or a control vector (SC shRNA) after ten days of clonal growth in methylcellulose. **p < 0.01, ***p < 0.005, ****p < 0.001 (unpaired t-test), n = 3. (f) Homology of the gRNA designed to target the murine Nap1l3 gene (the protospacer adjacent motif [PAM] = blue letters, the Cas9 nuclease cutting site = red arrow and the gRNA target sequence = bold letters). (g) Sequencing results of 30 clones of the Nap1l3 gene targeted by CRISPR-Cas9 in LSK HSCs (gRNA targeting sequence = bold letters, the PAM sequence = blue letters, and nucleotide changes relative to the WT Nap1l3 = red dashes or letters), and the genetic changes are indicated in the last column (h) Colony numbers resulting from sorted LSK HSCs expressing Cas9 transduced with an inducible gRNA vector targeting Nap1l3 (Nap1l3 gRNA), or a control vector (SC gRNA). The colonies were analysed after 10 days of clonal growth in methylcellulose supplemented with doxycycline. The data is represented as the mean ± s.e.m., *p < 0.05 (unpaired t-test), n = 3. (i) qPCR analysis showing Nap1l3 mRNA levels (normalised to Hprt) of enriched cKit+ HSCPs overexpressing Nap1l3 (OE Nap1l3), an empty vector (OE empty vector) or un-transduced cells. The data is represented as the mean ± s.e.m., ***p < 0.005 (unpaired t-test), n = 3. (j) The total number of colonies, GM and GEM colonies formed of sorted cKit+ HSCPs overexpressing Nap1l3 (OE Nap1l3) or an empty vector (OE empty), after ten days of clonal growth in methylcellulose. The data is represented as the mean ± s.e.m., **p < 0.01, ***p < 0.005, ****p < 0.001 (unpaired t-test).

