Figure 2.
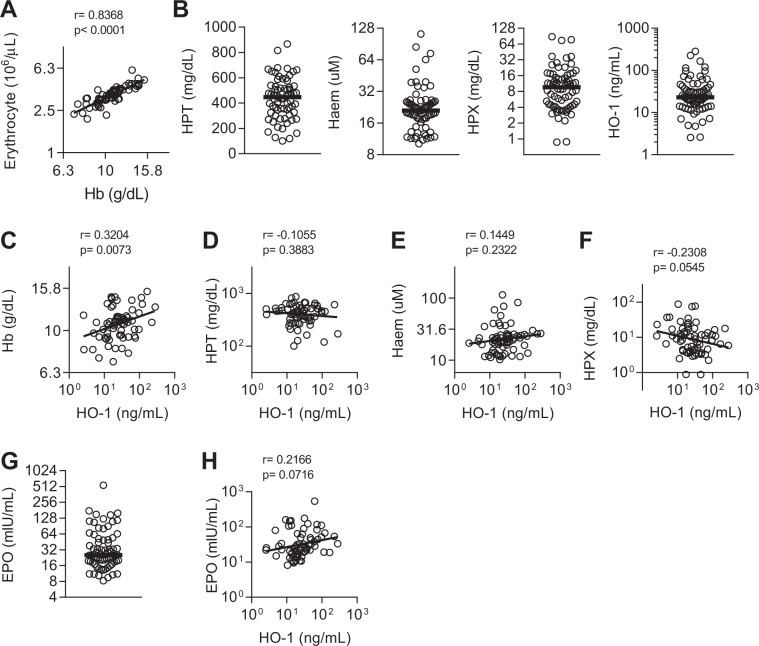
Haemolysis and HO-1 induction in sepsis patients. (A) Correlation between haemoglobin (Hb) concentration and circulating erythrocytes. (B) Plasma concentration of haptoglobin (HPT), haem, haemopexin (HPX), or haem oxygenase-1 (HO-1), and (G) erythropoietin (EPO). Dot plots show individual patient parameters. Black lines represent medians of septic patients, n = 70. Correlations between plasma HO-1 and (C) Hb, (D) HPT, (E) haem, (F) HPX, and (H) EPO. Log-transformed data shown with linear regression line. Pearson r and p-value shown.

