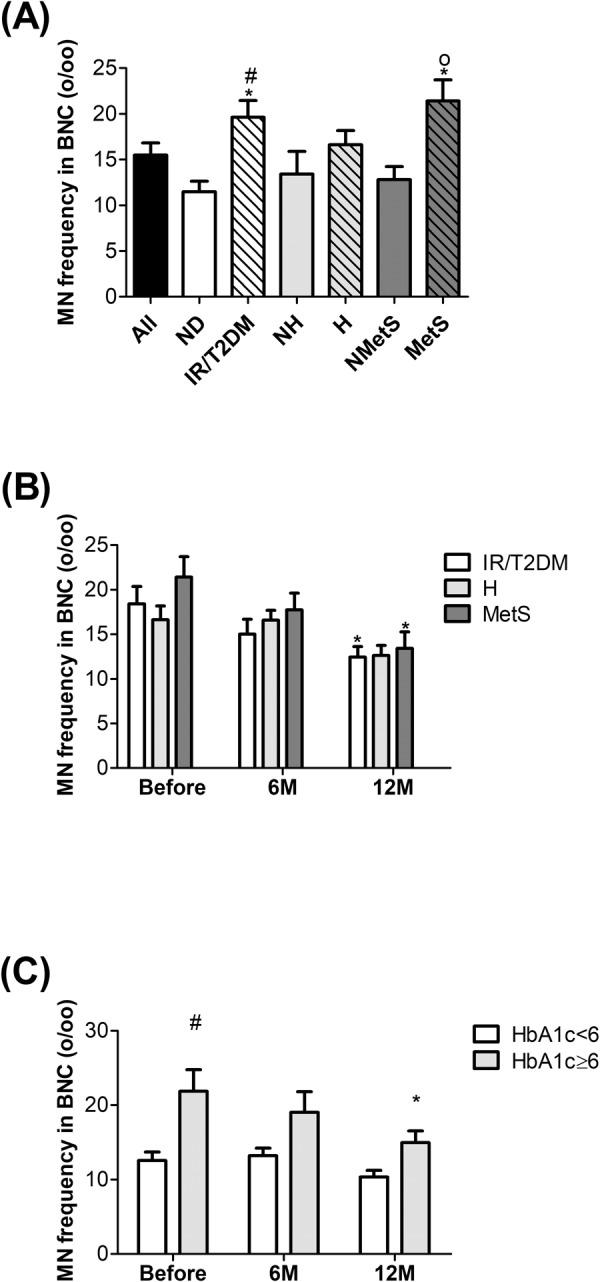
Figure 3.

Micronucleus frequency per mill (%o) among the subgroups of obese subjects before surgery. (A) Comparison of micronucleus frequency between all patients, nondiabetic (ND), IR/T2DM, nonhypertensive (NH), hypertensive (H), nonmetabolic syndrome (NMetS) and metabolic syndrome (MetS). (B) Comparison of micronucleus frequency between IR/T2DM, hypertensive (H) and metabolic syndrome (MetS) before and after surgery. (C) Comparison of micronucleus frequency between a subgroup of HbA1c < 6 and HbA1c ≥ 6 before and after surgery. Before surgery, nAll = 45, nND = 19, nIR/T2DM = 26, nNH = 16, nH = 29, nNMetS = 31 and nMetS = 14; 6 M, nIR/T2DM = 21, nH = 21, and nMetS = 10; 12 M, nIR/T2DM = 26, nH = 29 and nMetS = 14. *p ≤ 0.05 significant vs. All or vs. BeforeIR/T2DM or vs. BeforeMetS, #p ≤ 0.05 significant vs. ND or vs. BeforeHbA1c≥6 and op ≤ 0.05 significant vs. NMetS.
