
Fig. 2.
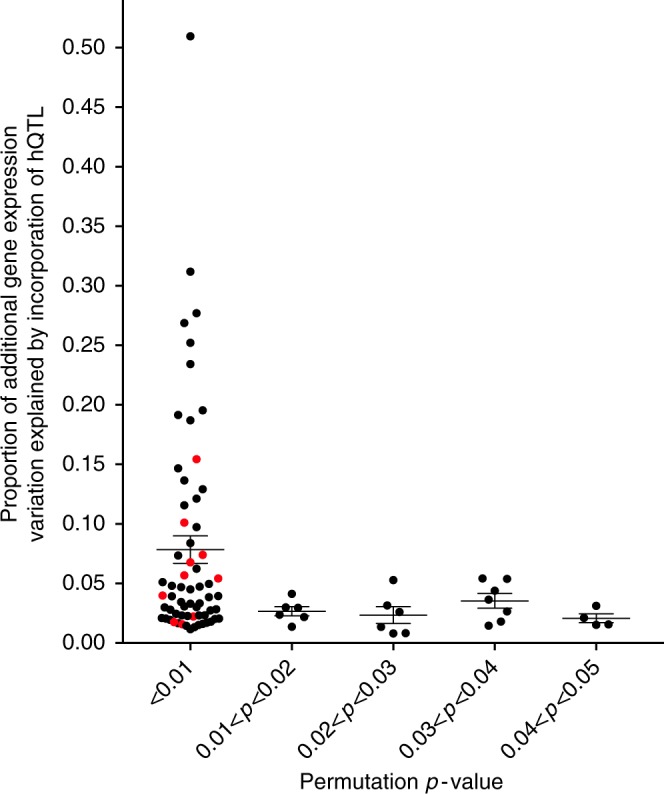
hQTLs impact gene expression in haplotype blocks that also contain eQTLs. Figure plots the 87 haplotypes for which the hQTL demonstrated significantly increased ability to model expression variation of the eQTL target gene (ppermutation < 0.05). The proportion of additional gene expression variation by incorporation of the hQTL genotypes (D2) is plotted on the y-axis and the permutation p-value is plotted on the x-axis. HLA haplotypes are colored in red and non-HLA haplotypes are in black