Fig. 3.
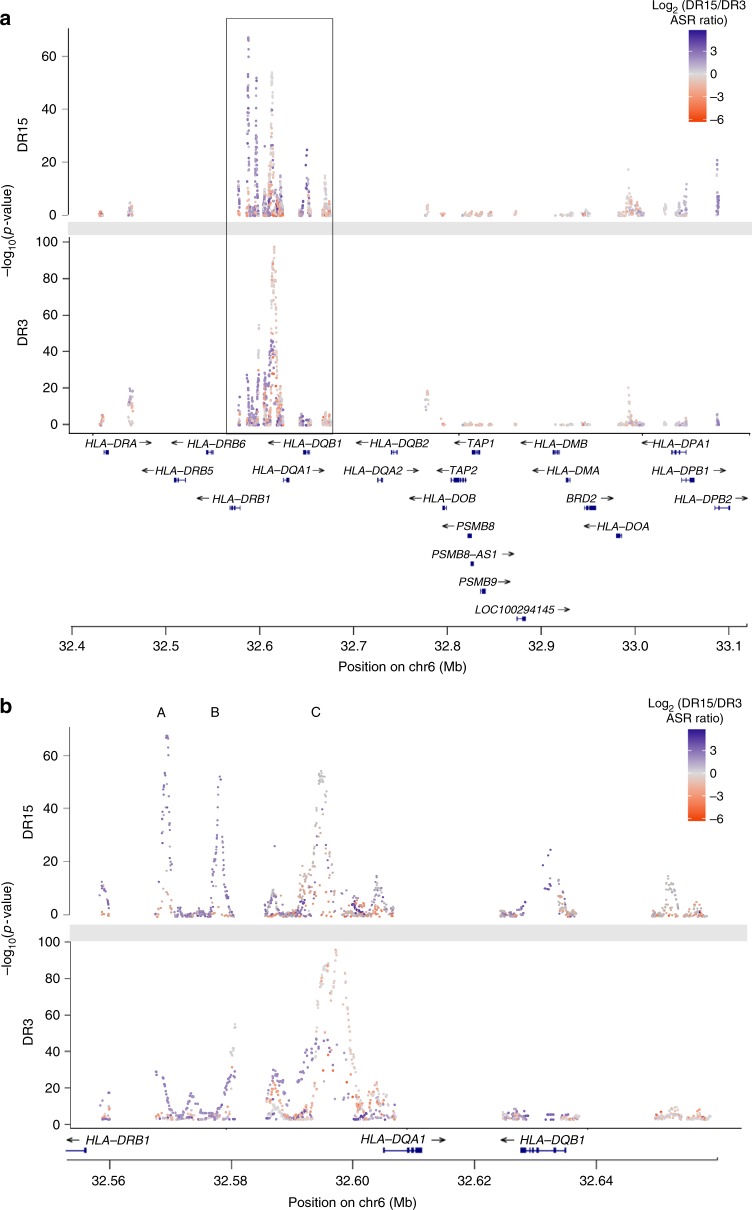
HLA Class II hQTLs have disproportionate DR15/DR3 ASE ratios. a Representation of HLA Class II (32.4–33.1 Mb) hQTLs by individuals heterozygous for the HLA-DR15 (top panel) or HLA-DR3 (bottom panel) haplotypes. Y-axis is the −log10(p) from the CHT; chromosome position (Mb) is plotted on the x-axis. hQTLs are colored by the log2(DR15 allele specific reads/DR3 allele specific reads); dark purple values (max = 5.63) indicate more allele specific reads at a particular SNP in the HLA-DR15 and dark orange values (min = −6.11) indicate more allele specific reads in the HLA-DR3 samples at a particular SNP. b Zoomed in region highlighted by black box in a (32.56–32.66 Mb) is displayed in b. Signals A (32.568–32.571 Mb), B (32.578–32.582 Mb), and C (32.588–32.606 Mb) are indicated

