Fig. 5.
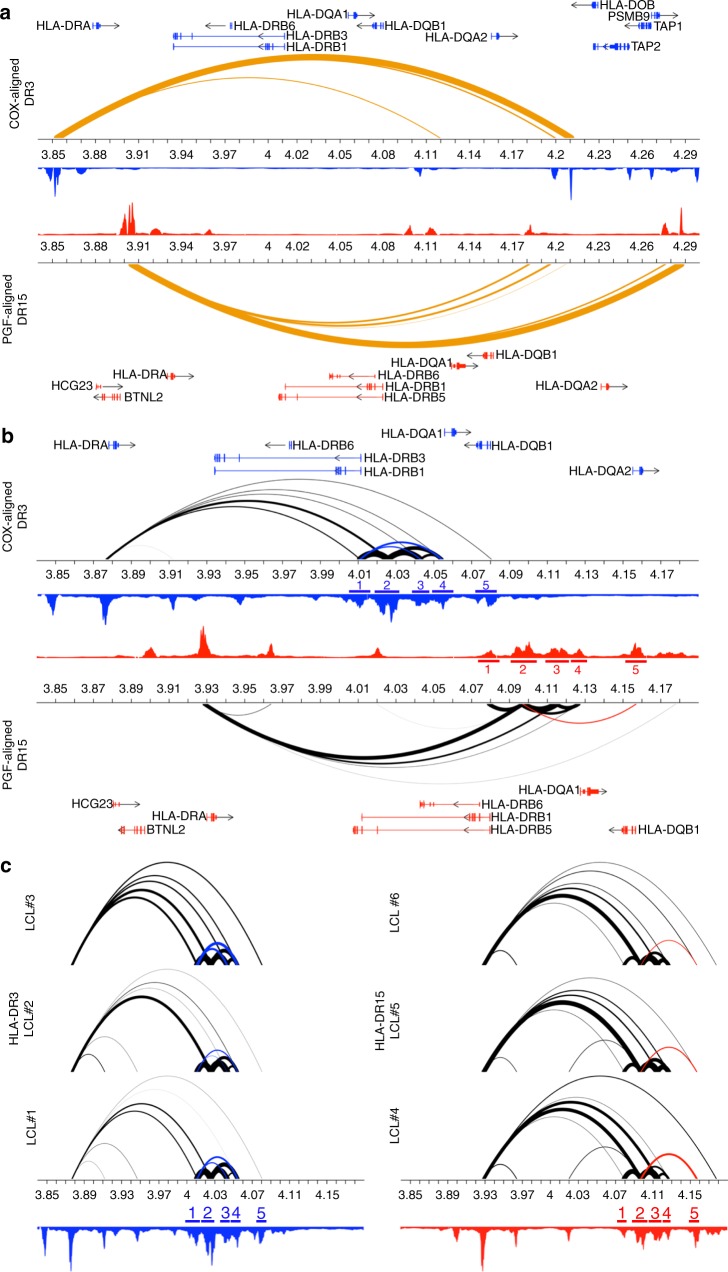
HLA Class II chromatin landscapes of HLA-DR3 and DR15 haplotypes. a CTCF HiChIP looping interactions within the HLA Class II region reveal an insulated neighborhood that extends from BTNL2 to upstream of HLA-DQA2. The COX-aligned DR3 haplotype is presented on top and the PGF-aligned DR15 haplotype is presented on the bottom. Gene and bp positions are presented specific for each haplotype. Orange arcs represent CTCF-mediated HiChIP interactions. Arc thickness is proportional to the frequency of observed paired-end tags (PETs) at each enhancer. b H3K27ac HiChIP looping interactions within the HLA Class II region reveal differential frequency and pattern in the HLA-DRB1 to HLA-DQB1 region between the HLA-DR15 and HLA-DR3 haplotypes. Black arcs represent H3K27ac-mediated HiChIP interactions. Significant p-values are presented for enhancers that exhibit differential binding frequencies (mean PETs) for one haplotype or the other and are colored by the haplotype that exhibits higher PET counts (HLA-DR3: blue; HLA-DR15: red). H3K27ac ChIP peaks are presented in blue (HLA-DR3) and red (HLA-DR15). Haplotype specific loops are indicated in blue (COX) or red (PGF). Corresponding haplotype specific enhancers are labeled as follows—COX: 1: 4.007–4.013 Mb, 2: 4.021–4.031 Mb, 3: 4.039–4.047 Mb, 4: 4.052–4.06 Mb, 5: 4.078–4.083 Mb; PGF: 1: 4.076–4.081 Mb, B: 4.092–4.102 Mb, C: 4.111–4.120 Mb, D: 4.124–4.129 Mb, E: 4.154–4.159 Mb. c Individual H3K27 HiChIP looping interactions for three subjects heterozygous for HLA-DR3 (left) and three subjects homozygous for HLA-DR15 (right). H3K27ac ChIP peaks, haplotype specific loops, and haplotype specific enhancers are presented in blue (HLA-DR3) and red (HLA-DR15)

