Fig. 7.
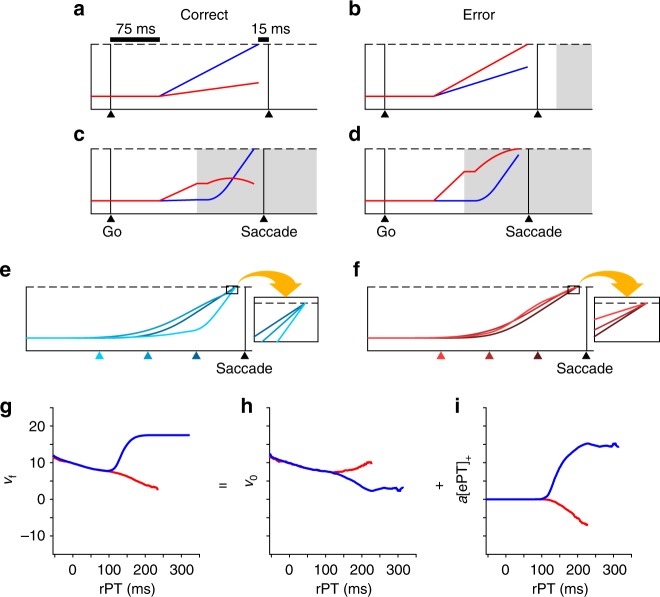
The accelerated race-to-threshold model provides a plausible physiological mechanism by which sensory evidence could influence saccade kinematics. a–d Four simulated trials of the accelerated race-to-threshold model. In each trial of the model, xL (red traces) and xR (blue traces) — representing the mean firing rates of two populations of oculomotor neurons — simultaneously rise toward a fixed threshold (dashed lines), competing to trigger a saccade toward the left or right, respectively. For simplicity, we have illustrated only trials in which the target is on the right and the distracter on the left. Black triangles and vertical lines indicate the onset of the go (Go) and saccade (Saccade). Shaded regions represent time after cue arrival. After a short, variable afferent delay following the go signal (fixed here at 75 ms for illustrative purposes only), xL and xR race toward threshold with initial, constant build-up rates drawn randomly from a bivariate distribution. a A correct guess results when the variable congruent with the target (xR; blue trace) reaches threshold before the competing variable, and before the cue information arrives. b An incorrect guess. c, d Time permitting, the cue information accelerates the variable congruent with the target and decelerates the variable congruent with the distracter. c A correct trial in which the motor activity congruent with the target accelerates to threshold after the cue arrives. d An incorrect trial in which the variable congruent with the distracter decelerates, but still reaches threshold after the cue arrives. e, f Mean firing rate trajectories (xR, xL) that reached threshold, resulting in correct (e) and incorrect (f) outcomes at short, intermediate, and long rPTs (dark, intermediate, and light hues, respectively). Colored triangles indicate average times of cue presentation relative to saccade onset (i.e., the time from each colored triangle until saccade is equal to the mean rPT of the simulated trials in that bin). Responses are aligned on saccade onset. g–i Mean vf (g), v0 (h), and a[ePT]+ (i) of correct (blue) and incorrect (red) trials as functions of rPT. Simulations were based on the behavioral data from subject R

