
Figure 2.
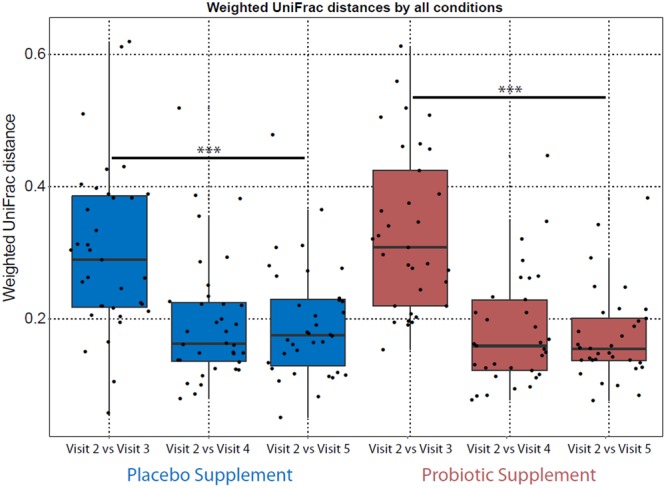
Weighted UniFrac distance (Beta diversity) analysis comparing how similar the microbiota is between the visits. Each dot represents one individual’s microbiota in visit 2 (baseline) that is compared to visits 3 (antimicrobial + probiotic/placebo supplement), visit 4 (probiotic/placebo supplement) and visit 5 (of wash-out). Two-way ANOVA followed by Tukey post-hoc test analysis showed that there was a significant difference for visit 3 compared to the other visits in both groups (***p-value < 0.001).