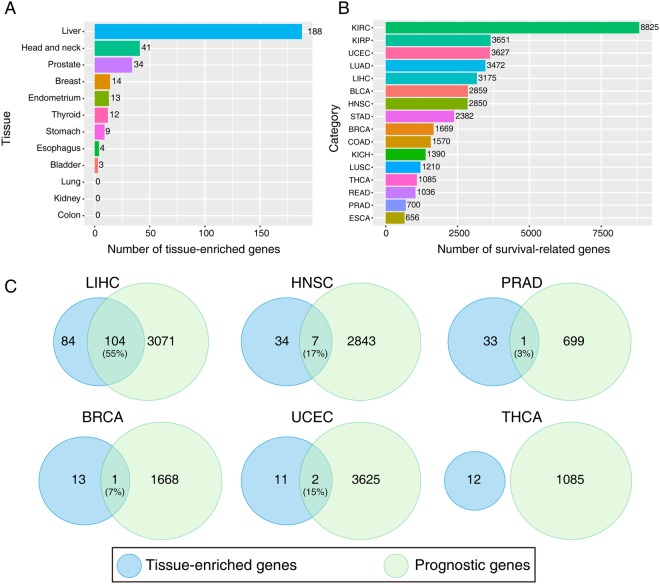
Figure 2.
Identification of tissue-enriched genes and prognostic genes. (A) Numbers of tissue-enriched genes in the 12 non-tumor tissue types. (B) Numbers of survival-related genes in the 16 cancer types. Genes with statistically significant differences (p < 0.05) by the Log-rank test were considered as survival-related genes with a median as cut-off value. (C) Venn diagrams showing number of tissue-enriched genes and prognostic genes and their overlap in different cancer types. The percentage of prognostic genes in liver-enriched genes is shown in parentheses.

