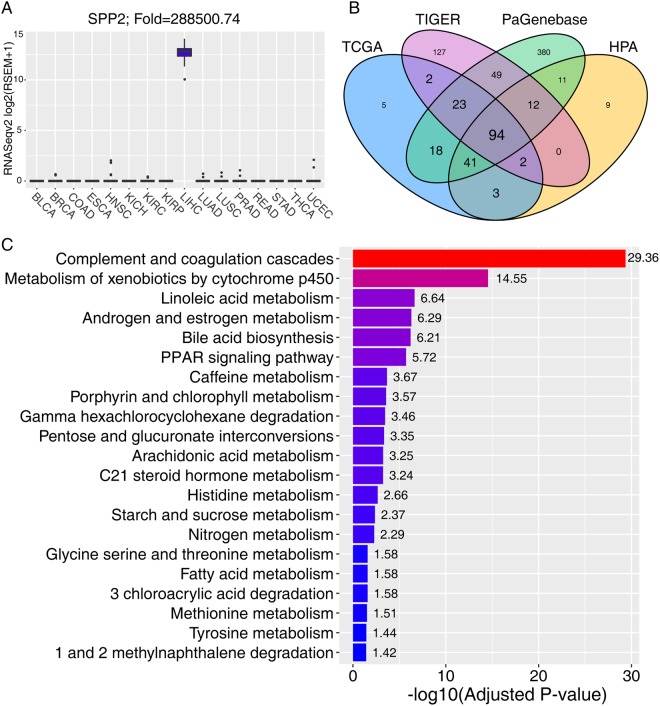
Figure 3.
Validation of liver-enriched genes and KEGG analysis. (A) An example of liver-enriched genes. SPP2 was exclusively expressed in the corresponding non-tumor tissues of HCC. (B) Four-set Venn diagram showing the overlap of the liver-enriched genes derived from the TCGA and three other databases, including HPA, PaGenBase and TiGER. (C) Significantly enriched KEGG pathways of 188 liver-enriched genes. −log10(adjusted p-value) was annotated on each bar of the KEGG pathway.

