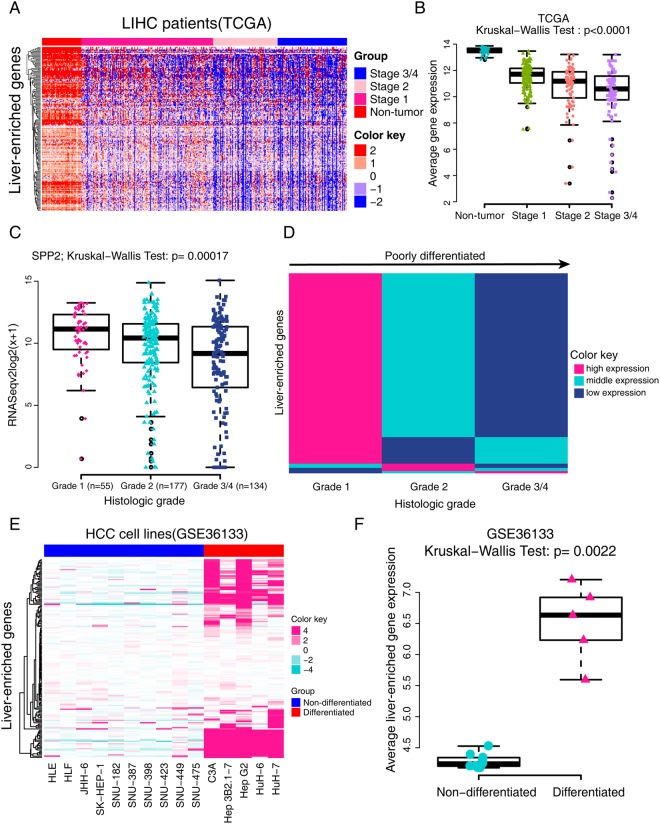
Figure 4.
Expression pattern of liver-enriched genes and its relationship with tumor dedifferentiation. (A) Heatmap displaying the expression pattern of liver-enriched genes in non-tumor tissues and HCC tissues with different pathological stages in the TCGA dataset. Red indicates high expression and blue indicates low expression. (B) Quantitative analysis of the expression pattern of liver-enriched genes in Fig. 4A. RSEM values were Log2 transformed, and the mean values of the liver-enriched genes in every sample were calculated. Then the Kruskal-Wallis test was used to compare differences among the four groups. (C) SPP2 was a typical example showing the expression level of liver-enriched genes in different histological grades. SPP2 expression decreased gradually with the progression of the tumor grade. (D) Heatmap showing the expression levels of 188 liver-enriched genes in different histological grades. Most liver-enriched genes displayed gradually reduced RNA expression correlated with the augment of tumor grade. (E) Comparison of mRNA expression profiles of liver-enriched genes in differentiated and non-differentiated HCC cell lines in GSE36133. Ten were non-differentiated HCC cell lines (HLE, HLF, JHH-6, SK-HEP-1, SNU-182, SNU-387, SNU-398, SNU-423, SNU-449 and SNU-475) and five were differentiated cell lines (C3A, Hep3B2.1-7, HepG2, HuH-6 and HuH-7). (F) Quantitative analysis of the expression pattern of liver-enriched genes in the differentiated and non-differentiated HCC cell lines.

