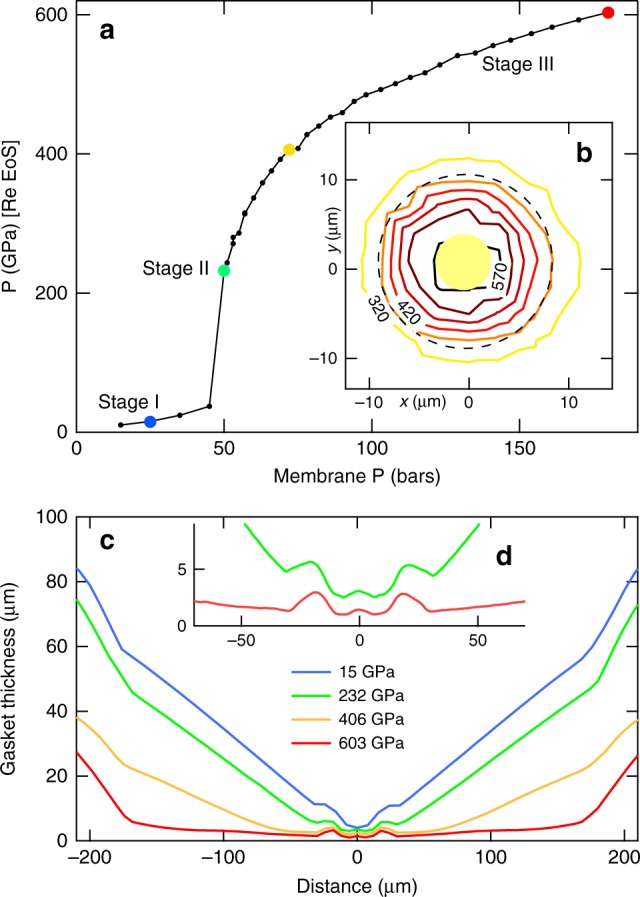
Fig. 2.

Stress and strain measured in run 1. a Pressure at the center of the toroidal-DAC (t-DAC) measured using the XRD signal of rhenium gasket and rhenium equation of state33 vs. membrane pressure. The membrane pressure is proportional to the load applied on the diamond table. The compression stages (I, II, and III) are discussed in the text. b Distribution of pressure measured every 3 μm along a 13 × 13 points grid, with the same method. The pressure at the center of the t-DAC is 585 GPa. The dashed line indicates the limits of the central flat and the yellow disc the extension of gold sample. c Thickness of the rhenium gasket measured using monochromatic X-ray (λ = 0.3738 Å) absorption profiles. The profiles have been measured at various pressures indicated by dots with the same color in the sample P vs. membrane P curve in a. The red profile corresponds to the data collected just before anvils breakdown. d Enlarged view of two profiles: the strain (“cupping”) of the central flat can be clearly seen
