Fig. 3.
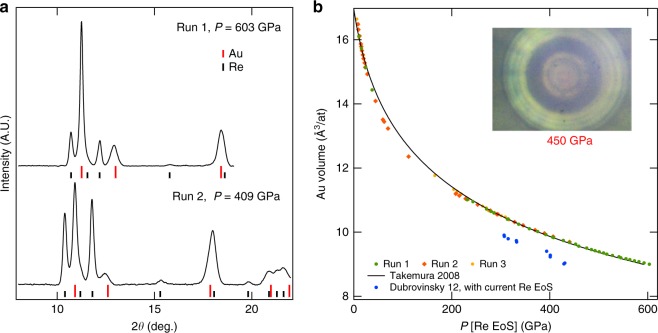
Gold equation of state data. a XRD spectra collected at the center of the pressure chamber for runs 1 and 2. The exposure time was 20 s. The red and black ticks indicate the positions of the XRD peaks of gold and rhenium, respectively. The (002) peak of gold is slightly shifted from its tickmark under the effect of deviatoric stress (see text). b Volume of gold measured up to 603 GPa in runs 1–3. It is based on the (111) diffraction line position, which is the least affected by non-hydrostatic stress37. The pressure is estimated using rhenium gasket equation of state 35. The black continuous line is the quasi-hydrostatic equation of state of gold, measured up to 131 GPa 39 and extrapolated here up to 600 GPa using the Rydberg–Vinet form. The blue dots are joint measurements of Au and Re lattice parameters in the ds-DAC18, converted to Au equation of state data points similarly to our data points. Inset: photograph of the sample chamber taken at 450 GPa in run 1

