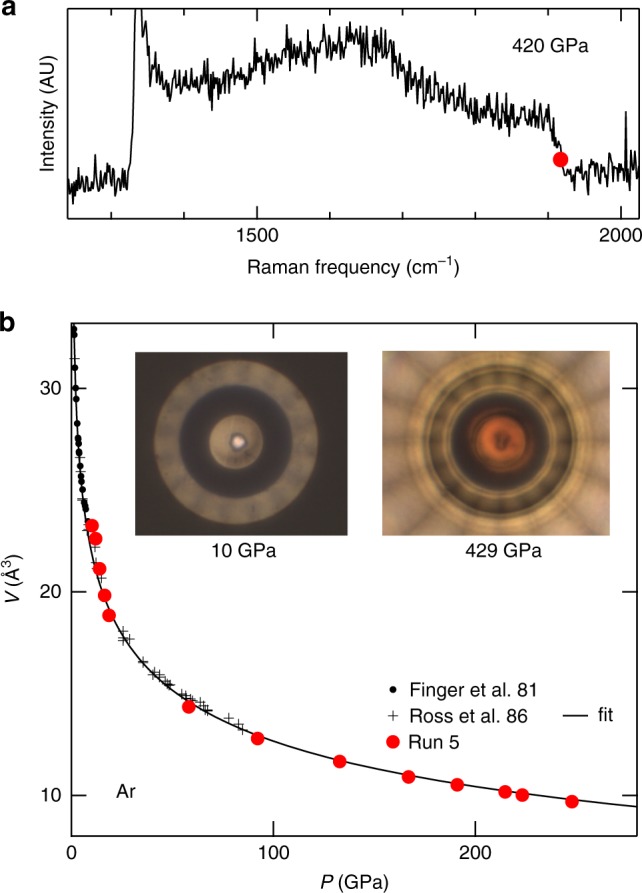
Fig. 6.

Argon equation of state data. a Raman spectrum collected at the center of the toroidal-DAC at the end of run 5. The position of the high-frequency edge of the diamond anvil (minimum of the differential spectrum) is indicated by a red disc. It corresponds to a pressure of 420 GPa using the high-pressure calibration35. b Volume of argon measured in run 5, compared with the equation of state obtained by a fit of lower pressure data points51,52 (black line). Insets: photographs of the sample. The image at 429 GPa is blurred by birefringence of the diamond anvil under high stress; the red color seen on the diamond tip is attributed to the closure of the diamond band gap32
