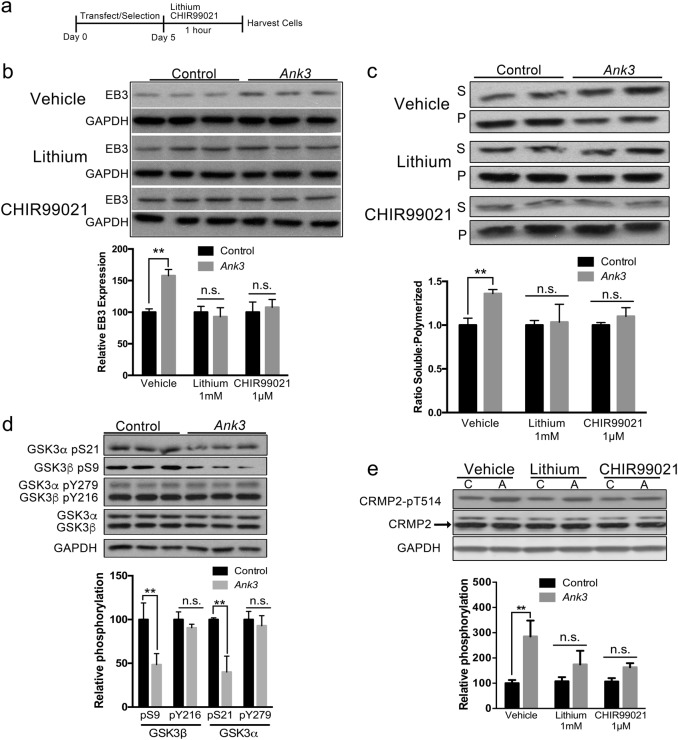
Fig. 4. Changes in EB3 expression and tubulin polymerization induced by brain-specific Ank3 repression are normalized by inhibition of GSK3.
a Schematic representation of the experimental design. Mouse neuro-2a cells were transfected with pHAGE-EF1α-dCas9-KRAB repressor plasmid and sgRNA(MS2)_EF1α plasmid expressing either the non-targeting control sgRNA or the sgRNA targeting Ank3 exon 1b, followed by puromycin and zeocin selection, and treatment with lithium (1 mM), CHIR99021 (1 µM), or DMSO vehicle for 1 h prior to cell harvest for protein extraction. b Top: Representative western blot of EB3 and GAPDH. Bottom: Quantification of EB3 expression normalized to GAPDH. Two-way ANOVA, drug effect F(2,30) = 4.217 P = 0.02, Ank3 repression effect F(1,30) = 4.137 P = 0.05, interaction F(2,30) = 4.217, P = 0.02. c Top: Representative western blot of α-tubulin in soluble (S) and polymerized (P) protein fractions. Bottom: Quantification expressed as the ratio of α-tubulin in soluble and polymerized fractions. Two-way ANOVA, drug effect F(2,28) = 2.460 P = 0.10, Ank3 repression effect F(1,28) = 3.281 P = 0.08, interaction F(2,28) = 5.463 P = 0.01. d Top: Representative western blot of GSK3α/β phosphorylation at serine 21 (GSK3α-pS21), serine 9 (GSK3β-pS9), tyrosine 279 (GSK3α-pY279), and tyrosine 216 (GSK3β-pY216), total GSK3α and GSK3β, and GAPDH. Bottom: Quantification of GSK3β-pS9 and GSK3β-pY216 normalized to total GSK3β, and GSK3α-pS21 and GSK3α-pY279 normalized to total GSK3α. e Top: Representative western blot of CRMP2 phosphorylation at threonine 514 (CRMP2-pT514), total CRMP2, and GAPDH. Bottom: Quantification of CRMP2-pT514 normalized to total CRMP2. Two-way ANOVA, drug effect F(2,12) = 4.137 P = 0.05, Ank3 repression effect F(1,12) = 3.281 P = 0.08, interaction F(2,12) = 4.217 P = 0.02. Western blot data were averaged from three independent experiments with three biological replicates per group in each experiment. Control or C, non-targeting sgRNA; Ank3 or A, sgRNA targeting Ank3 exon 1b. The data were analyzed using two-tailed Student’s t test or ANOVA and Bonferroni post hoc tests. Data are presented as mean ± s.e.m. * P < 0.05, **P < 0.01. n.s. indicates not significant

