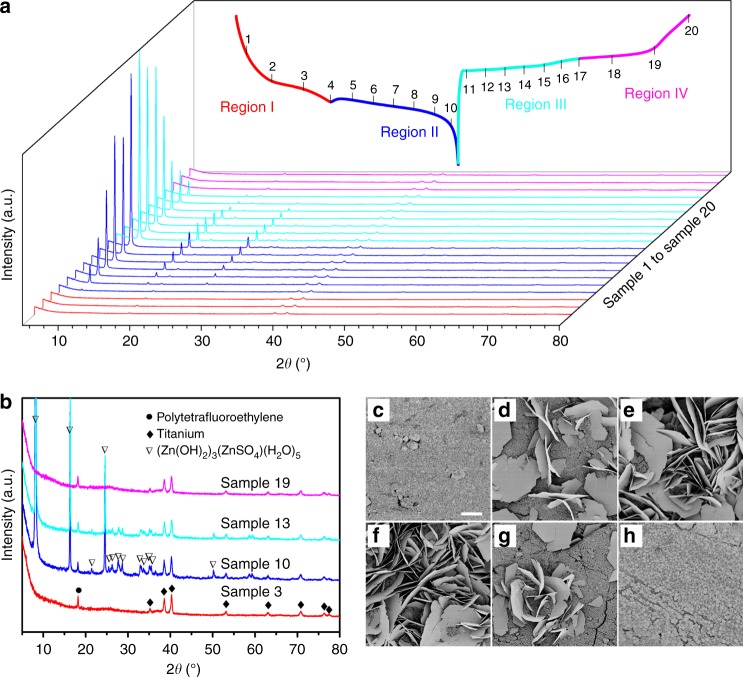
Fig. 3.
Structure evolution of polyaniline-intercalated MnO2 electrode during cycling. a Evolution of ex situ X-ray powder diffraction (XRD) patterns during the charge/discharge process (the vertical bars denoted with consecutive numbers indicate the locations where the XRD patterns were recorded). b Selected ex situ XRD patterns from a (corresponding to the XRD patterns denoted with 3, 10, 13, and 19 in a), which represent the typical XRD pattern in each corresponding charge/discharge region. c–h Scanning electron microscopy (SEM) images for morphologic evolution of electrode during cycling (the SEM images were taken at the locations indicated by vertical bars 3, 5, 10, 12, 16, and 20 in a, respectively). Scale bars, c–h 10 μm, respectively (the magnification is the same for images c–h)

