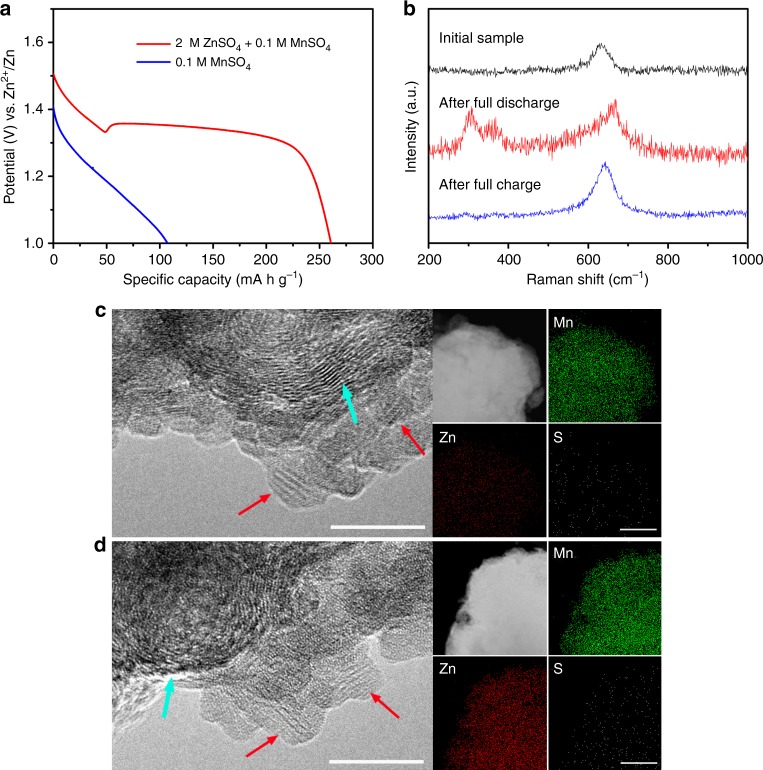
Fig. 4.
Characterization of sequential insertion of H+ and Zn2+ during two discharge platforms. a The discharge profile of polyaniline (PANI)-intercalated MnO2 electrode at current density of 50 mA g−1 in different electrolytes (red curve: 2 M ZnSO4 + 0.1 M MnSO4, blue curve: 0.1 M MnSO4). b Raman spectra of PANI-intercalated MnO2 electrode after full discharge and full charge. c High-resolution transmission electron microscopy (HR-TEM) image of the testing electrode after the first discharge platform and the corresponding scanning transmission electron microscopy–energy dispersive spectroscopy (STEM–EDS) mappings for elements like Mn, Zn, and S. d HR-TEM image of the testing electrode after the second discharge platform and the corresponding STEM–EDS mappings for elements like Mn, Zn, and S. Red arrows indicate the PANI-intercalated MnO2 nanolayers and cyan arrows indicate the acetylene black in electrode. Scale bars, c, d 10 nm for TEM images and 100 nm for STEM–EDS mapping images

