Fig. 2.
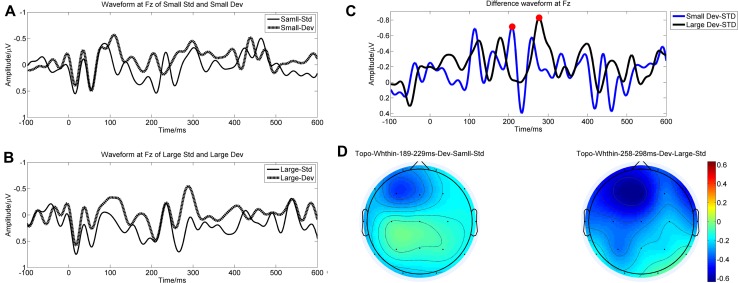
Grand averaged waveforms and topographies. A Grand averaged waveform of responses to small deviant stimuli and the sweep before it at electrode Fz. B Grand averaged waveform of responses to large deviant stimuli and the sweep before it at electrode Fz. C Grand averaged difference waves (at electrode Fz) of large (black line) and small (blue line) deviant stimuli. D Topography of mean MMN amplitude within the time window (time window of small deviant: 189 ms–229 ms; time window of large deviant: 258 ms–298 ms).

