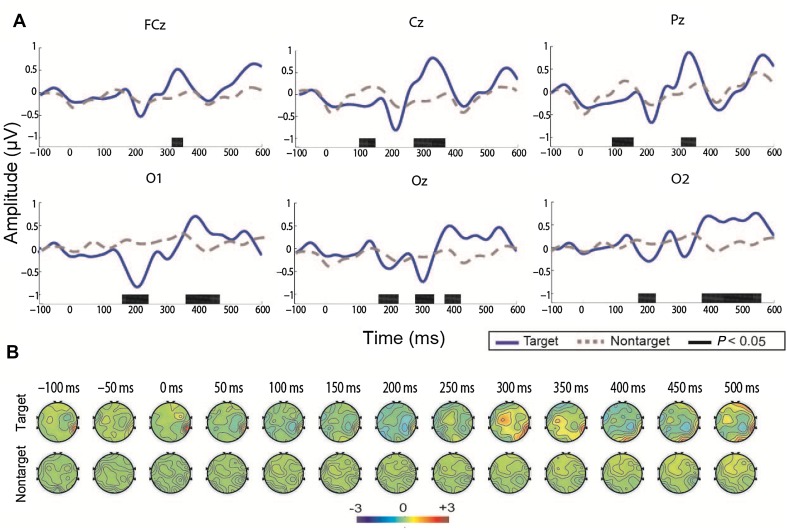
Fig. 2.
Averaged ERP waveforms and scalp topography of five healthy participants. A Waveforms from 100 ms before the stimulus onset to 600 ms after stimulus onset in the six channels (FCz, Cz, Pz, O1, Oz, and O2). Black bars, time intervals with significant differences of the waveforms evoked by target and non-target (two-sample t-test, P < 0.05). B Scalp topography averaged from the 5 healthy participants.

