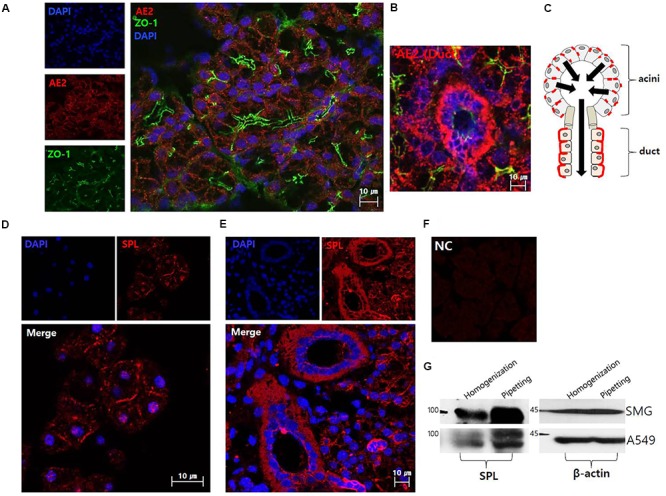
FIGURE 1.

The localization of anion exchanger AE2 and salivary SPL. (A) The plasma membrane expression of native AE2 in SMG tissues. Co-staining with ZO-1 (green), AE2 (red), and DAPI (nucleus, blue) in SMG tissues. (B) Ductal expression of AE2 (red). (C) The figure was illustrated the localization of AE2 in salivary acini and ductal cells. Black arrows represent the secretion flow. Immunostaining of SPL (red) and DAPI (blue) in isolated SMG acini (D) and SMG tissues (E). (F) Negative control (NC) of immunofluorescence image without primary SPL antibody of SMG tissue. (G) Protein expression of SPL in isolated SMG cells and A549 cell line with different protocol of cell lysis. The A549 cells were used as a positive control for SPL expression. The β-actin blot was used as a loading control.
