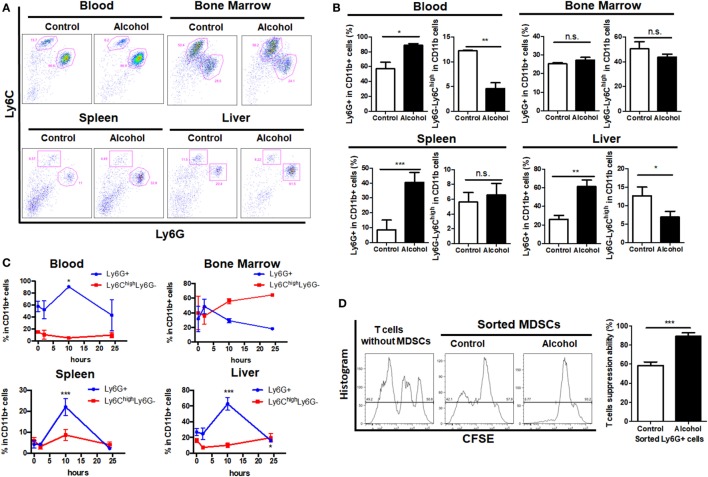
Figure 1.
Profile of myeloid-derived suppressor cells (MDSCs) populations in mice treated with vehicle or ethanol. Mice were divided into two groups, ethanol group (n = 6) treated with a single dose of ethanol (6 g/kg body weight) via gavage and control group (n = 6) received isocaloric dextrin-maltose. After 10 h, mice were sacrificed and cells were obtained from blood, liver, spleen, and bone marrow for flow cytometric analyses. (A) Representative images and (B) quantification of flow cytometric analyses of cells from blood, spleen, liver, and bone marrow of mice with vehicle or ethanol treatment. Then time frame of MDSCs in response to ethanol treatment was elaborated. Mice were sacrificed at 2 h (n = 6), 10 h (n = 6), and 24 h (n = 6) after the ethanol treatment, and populations of granulocytic-MDSCs (G-MDSCs) and monocytic-MDSCs (M-MDSCs) were determined by flow cytometer. (C) Time course of G-MDSCs and M-MDSCs in tissues after ethanol exposure. Change of the MDSCs population was normalized within 24 h after a single dose of ethanol. G-MDSCs were sorted from mice treated with vehicle or ethanol by FACS Aria I cytometer (BD) and co-cultured with carboxyfluorescein succinimidyl ester (CFSE)-labeled cytotoxic T cells sorted from spleen of naïve mice. (D) Representative histogram images of flow cytometric and quantification analyses of CFSE intensity in CFSE-labeled T cells co-cultured with G-MDSCs cells treated with ethanol or vehicle. Data were analyzed as mean value ± SD and Student’s T-test was used to assess the result significance. *p < 0.05, **p < 0.01, ***p < 0.001, compared with the control group; n.s., not significant.

