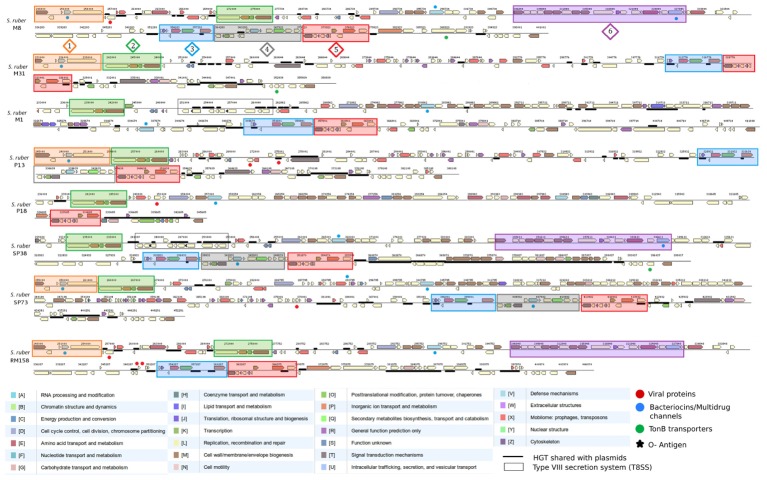
FIGURE 4.
Comparison of the genomic architecture, gene content and cluster distribution, of fGI1 (HRV1) among the eight considered strains. Genes are colored based on their COG-based functional classification and relevant events are labeled with different symbols: viral proteins (red dots), multidrug/bacteriocins (blue dots), heavy metal resistance and tonB transporters (green dots) andO-Antigens (o-chain) (black stars). Six different syntenic clusters or cassettes were identified and delimited in numbered color filled boxes. Regions shared with plasmids appears as underlined. Structural similarities between M8 and RM158 fGI-1 suggest extensive HR from a related strain are usually followed by insertions from plasmids as in the case of the 7 Kb sequence in 3′ RM158 fGI-1 extreme homologous to RM158-pSR67. A similar case is represented for M31 and P13 fGIs, that presented the main differences in 5′ fGI-1 extreme.

