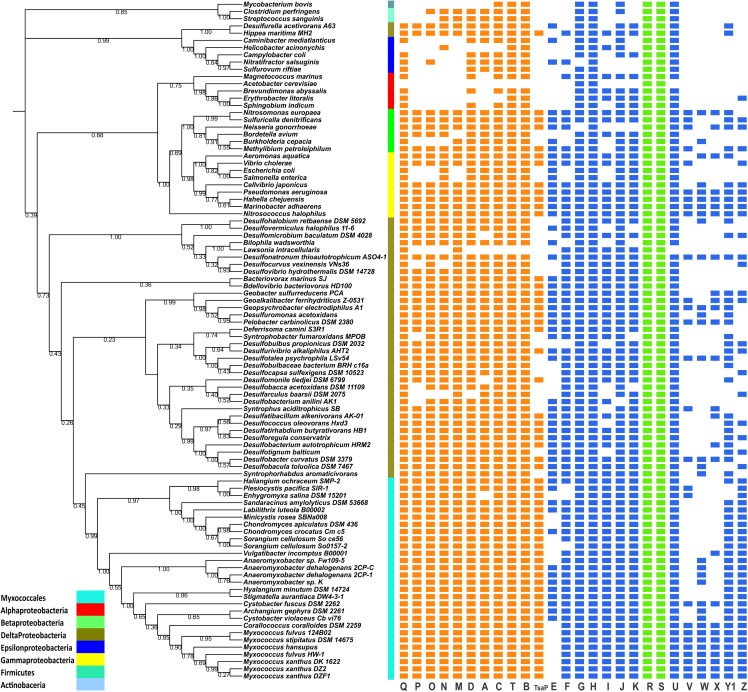
FIGURE 1.
Distribution of T4aP genes among myxobacteria and outgroup organisms. The distribution of myxobacterial T4aP genes is mapped to a 16S rRNA-based phylogenetic tree using iTOL [https://itol.embl.de/]. Between the phylogenetic tree and gene distribution, taxonomy is mapped according to the color codes shown in the left corner. All genes are represented here with equal lengths and color codes: core T4P genes = orange; non-core T4P genes = blue; regulatory genes within T4P clusters (pilR and pilS) = green. Bootstrap values corresponding to the tree nodes are provided.

