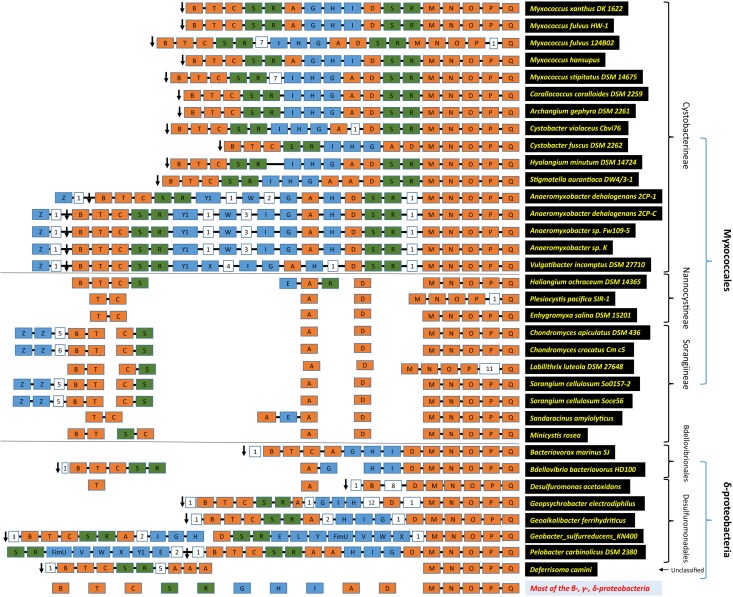
FIGURE 3.
T4aP cluster architecture. The modular organization of the T4aP loci is depicted according to the direction of transcription as in MxDK1622, going from left to right, using the color codes; core pili proteins as orange, rest of the pili genes as blue, and regulatory pili genes (pilR and pilS) as green. Digits in white boxes represent the number of intervening genes. The black arrow represents riboflavin kinase. Connecting black lines between boxes depict contiguous genes. Taxonomy and organism names are on the left.

