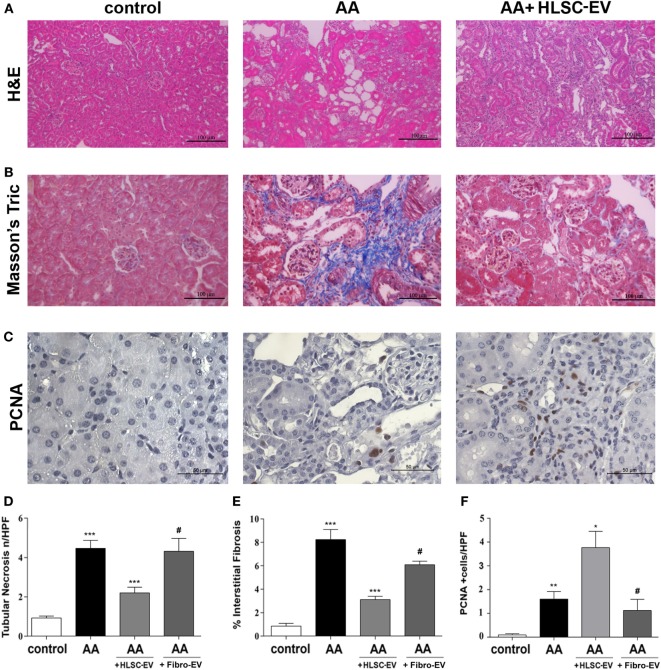
Figure 2.
Histological analyses of aristolochic acid nephropathy (AAN) in vivo model. (A) Representative micrographs of H&E-stained renal tissue from healthy mice injected with vehicle alone (control), or mice injected with aristolochic acid (AA), or AA mice treated with human liver stem cell-derived extracellular vesicles (HLSC-EVs). (B) Representative micrographs of Masson’s trichrome stained renal sections from control, AA, or HLSC-EVs treated AA mice. The blue stain represents collagen fibres considered to be a marker for interstitial fibrosis. Original magnification at 400×. (C) Representative micrographs of proliferating cell nuclear antigen (PCNA) stained renal tissue of control, AA, or AA mice treated with HLSC-EVs original magnification at 400×. (D) Histological score of tubular necrosis in AAN mice experimental groups. Mice treated with AA had significantly elevated levels of tubular necrosis, which was alleviated on treatment with HLSC-EVs. No significant reduction in tubular necrosis was observed in mice treated with Fibro-EVs. Data represent mean ± SD of tubular necrosis observed under high power field (original magnification: 400×). A one-way analyses of variance (ANOVA) with Bonferroni’s multi comparison test was performed. ***p < 0.001 AA vs control or HLSC-EVs vs AA, #p < 0.01 Fibro-EVs vs HLSC-EVs. (E) Histological quantification of interstitial fibrosis in AAN mice experimental groups by multiphase image analysis of 10 fields per section. Data represent mean ± SD; a one-way ANOVA with Bonferroni’s multi comparison test was performed. ***p < 0.001 AA vs control, **p < 0.01 HLSC-EVs vs AA, #p < 0.01 Fibro-EVs vs HLSC-EVs. (F) Histological score of PCNA positive cells in AAN mice experimental groups observed under high power with an original magnification of 400×. An increase in PCNA positive cells (marker for proliferation) was observed in HLSC-EVs treated mice renal tissue. No significant increase in PCNA was observed in AA mice treated with Fibro-EVs compared to control. Data represent mean ± SD. A one-way ANOVA with Bonferroni’s multi comparison test was performed. **p < 0.01 AA vs control, or Fibro-EVs vs HLSC-EVs, *p < 0.05 HLSC-EVs vs AA, #p < 0.01 Fibro-EVs vs HLSC-EVs (n = 9 mice per group).

