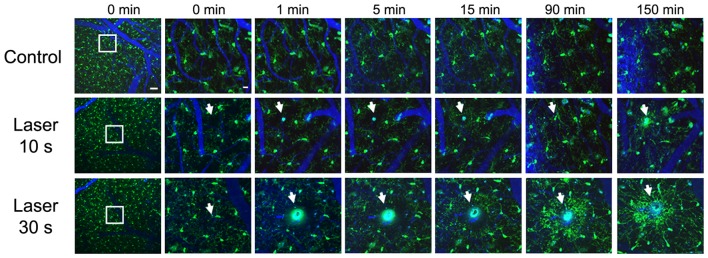
Figure 2.
Real time in vivo multiphoton imaging of microglia in the cerebral cortex from CX3CR1-GFP mice. Representative images of sequential follow up of a control mouse and two mice after parenchyma laser ablation for 10 and 30 s. Same regions are imaged before the lesion, immediately after, 1, 5, 15, 90 and 150 min afterwards. Microglia processes start going towards the lesion site as soon as 1 min after laser ablation and the processes continue extending towards the lesion 150 min later. Vessels (blue) are filled with Texas Red dextran 70 KD, microglia (GFP, green) and white arrows point to laser ablation sites. Scale bar 50 μm and insets 12 μm.

