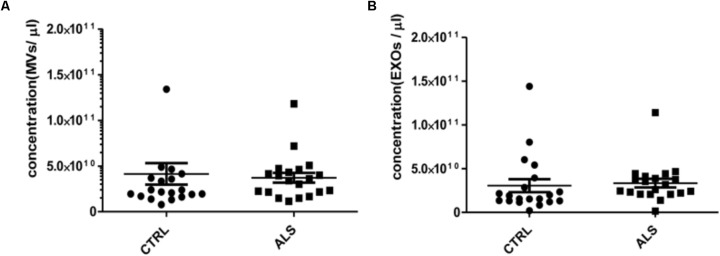
FIGURE 2.
MVs and EXOs abundance do not differ between ALS patients and controls. NTA was performed on MVs and EXOs extracted from plasma of healthy controls and ALS patients (n = 20 per group). When averaged, the concentration of MVs (A) and EXOs (B) was not significantly different between the two groups (for MVs CTRLs 4.14 ×10¹⁰± 1.18 × 10¹⁰ vs. ALS 3.72 × 10¹⁰ ± 5.44 × 10⁹ particles/mL and for EXOs CTRLs 3.05 ×10¹⁰± 7.40 × 10⁹ vs. ALS 3.35 × 10¹⁰ ± 4.96 × 10⁹ particles/mL).

