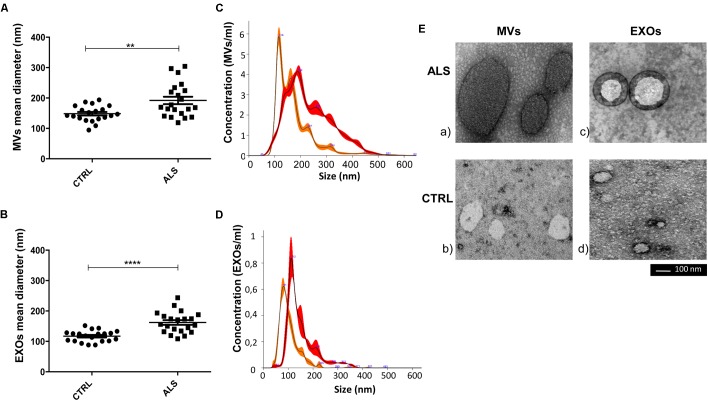
FIGURE 3.
Mean diameter of MVs and of EXOs from ALS patients were significantly higher than healthy donors (CTRLs). Dot plot of the mean size of plasma derived MVs (A) and EXOs (B) of 20 ALS patients and 20 healthy individuals are shown (t-test, ∗∗p < 0.01, ∗∗∗∗p < 0.0001). (C,D) NTA profiles overlay between ALS MVs (red line-mean = 234.3 ± 1.7 nm) and CTRL MVs (orange line-mean = 174.7 ± 1.8 nm) and ALS EXOs (red line-mean = 150.3 ± 3.5 nm) and CTRL EXOs (orange line-mean = 103.7 ± 0.7 nm). The peak size represents the mode; (E) Representative images obtained by transmission electron microscopy (TEM) of MVs and EXOs of an ALS patient (ALS) and a healthy control (Scale bar: 100 nm). Images were cropped and original images are shown in Supplementary Figure 1. Diameter of MVs and of EXOs from ALS patients were significantly higher than healthy donors (Supplementary Figures 1A,B for MVs; Supplementary Figures 1C,D for EXOs). Full figures are represented in Supplementary Figure 1.

