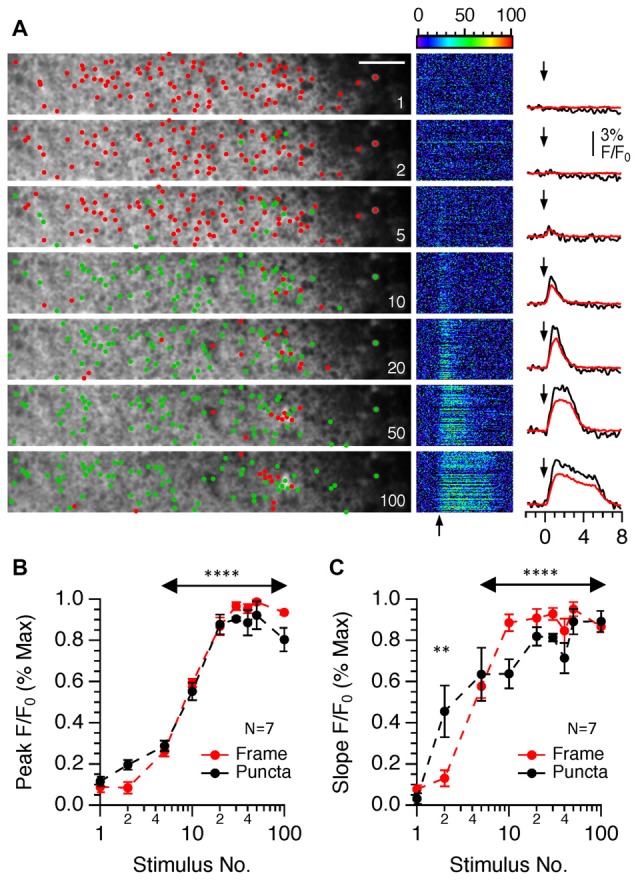
Figure 6.

The effects of changing the stimulus number on SyGCaMP2 responses in single presynaptic boutons in the CA1 region of the hippocampus. Images consisting of 512 pixels by 64 lines were scanned at rates of 98 ms and trains of 1–100 stimuli were delivered at 20 Hz at a fixed intensity of 40 volts. (A) Data are illustrated in the same way as Figure 5D except that in the right-hand column the averages of responding puncta are shown to the right in black and the total frame fluorescence for each stimulus condition is shown in red. Arrows indicate the onset of electrical stimulation. Green and red dots positioned at the point of maximum intensity for each ROI distinguish responding and non-responding ROIs respectively. The scale bar represents 10 μm. Panel (B) shows the effect of stimulus number on the amplitude of the peak SyGCaMP2 responses for the total frame (red trace) and for only responding puncta (black trace). The effects on the initial slopes of responses are shown in panel (C). A Kruskall-Wallace test was used to examine if there were any significant differences between peak and initial slopes of SyGCAMP2 responses to stimulus number. (**P = 0.0036; ****P < 0.0001). Data are presented as means and SEM for seven slices from four mice.
