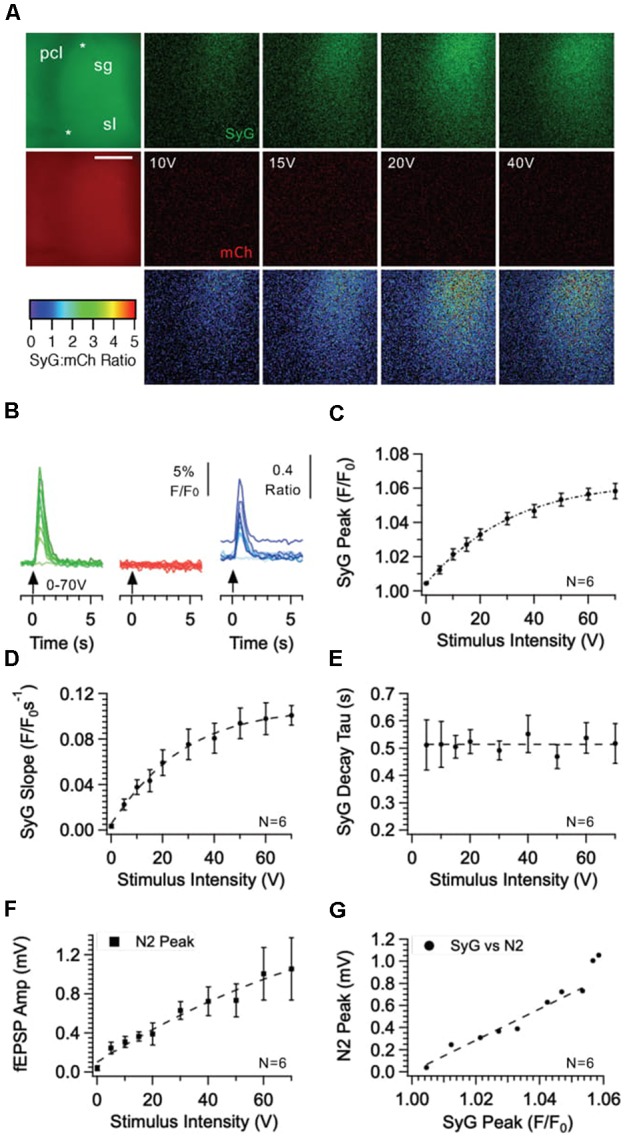
Figure 8.

Effect of stimulus intensity on fluorescence responses recorded from the CA3 region of the hippocampus in SyGCaMP2-mCherry expressing mice. Bursts of 10 stimuli over a range of intensities were delivered at 20 Hz via a patch pipette placed s. granulosum of the dentate gyrus. Images of SyGCaMP2 (green) and mCherry fluorescence (red) are shown along with the ratio of the two and images illustrating the difference in fluorescence for each fluorophore and their ratio before and during stimulation at each intensity labeled (A). The positions of the stimulating and recording electrodes are marked with upper and lower asterisks respectively. Abbreviations: pcl; pyramidal cell layer; sg; s. granulosum; sl; stratum lucidum. The horizontal scale bar represents 100 μm. Responses over time are shown (B) for SyGCaMP2 and mCherry fluorescence extracted from ROIs placed over the s lucidum (sl). The ratios of SyGCaMP2:mCherry fluorescence at each intensity are shown in blue. Increasing intensities are depicted with darker hues. The mean and SEM peak (C), initial slope (D) and decay time constant (E) of SyGCaMP2 fluorescence responses and the N2 component of fEPSPs (F) are plotted against intensity. The relationship between SyGCaMP2 and N2 peak responses is shown in panel (G). A line of best fit was plotted for values measured below 50 V where the relationship was linear. Data were obtained from six separate hippocampal slices taken from four different mice.
